Data
Edstats
Data Query Frequently Asked Questions (FAQs)
|
EdStats' data queries are part of the World Bank's data query system, the World DataBank. The system
has advanced functions for selecting and displaying data, performing customized queries, downloading data, and creating charts and maps. Users can create
dynamic custom reports based on their selection of countries, indicators and years. All these reports can be easily edited, shared, and embedded
as widgets on websites or blogs.
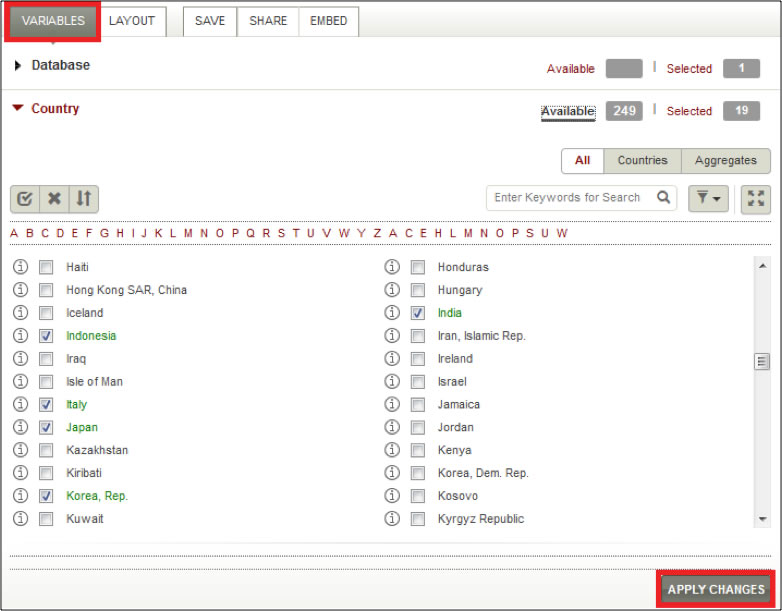
There are five ways to make country selections: Option 1: Scroll through the list in the Country section of the Variables tab, then check the boxes to indicate your selection. Option 2: Click on the first letter of the country name in the Alphabet bar, then check the boxes to indicate your selection.
Option 3: Enter the name or code of the country in the search box, then check the boxes to indicate your selection.
Note: You can search for multiple countries at once.
Option 4: Click on the Filter button to display the country list according to specific groups and subgroups, then check the boxes to indicate your selection. Countries are displayed as:
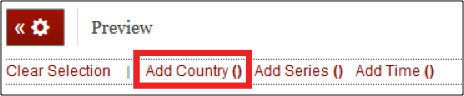
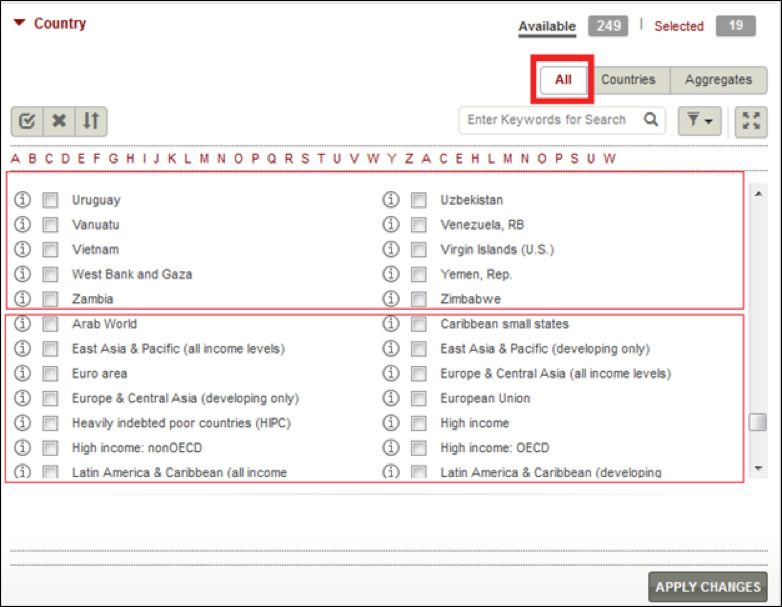
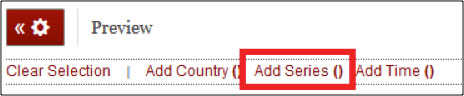
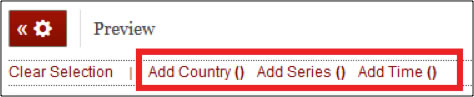
Option 5: Click on Add Country in the Preview panel of the Report page. This will open a new window containing the list of countries. You can then make your selections using any of the first four methods mentioned above. Selecting Aggregates By default, the country list is generated when you click on the Country section of the Variables tab. To select aggregates, click on the Aggregates button and choose from the list. Note: You can have Countries and Aggregates on the same list by clicking on the "All"
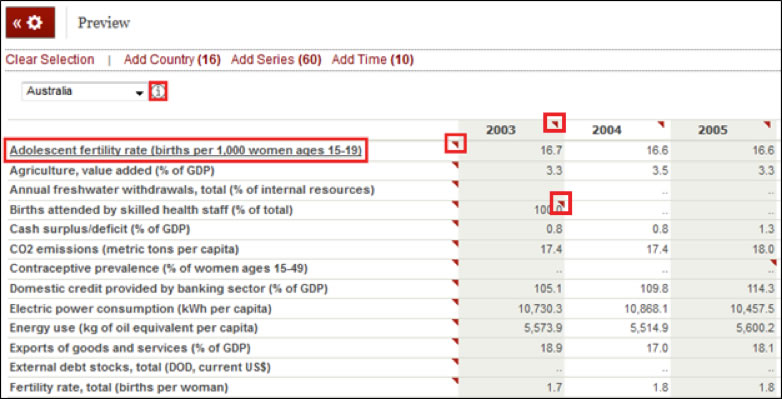
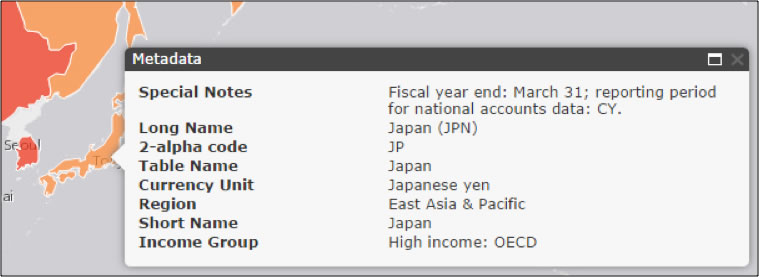
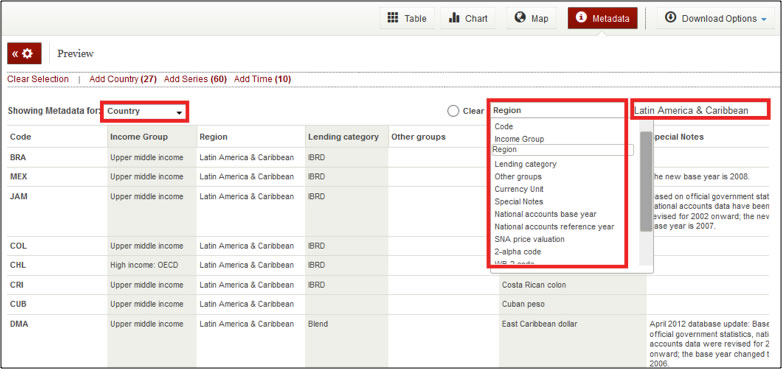
How do I view country and indicator metadata/notes? Notes containing indicator- or country-specific information can be viewed by clicking on the "information" To view metadata in the Preview section of the Report page:
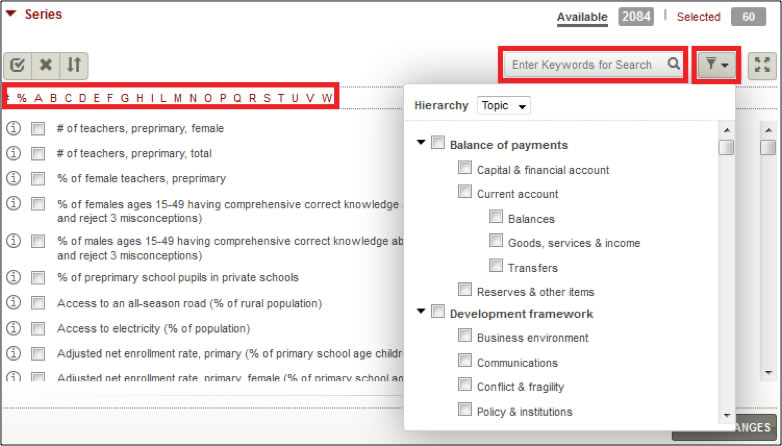
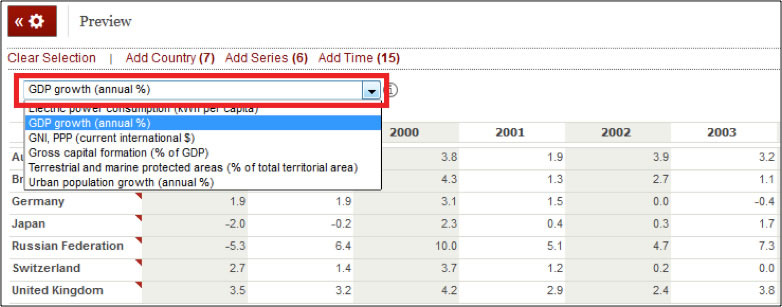
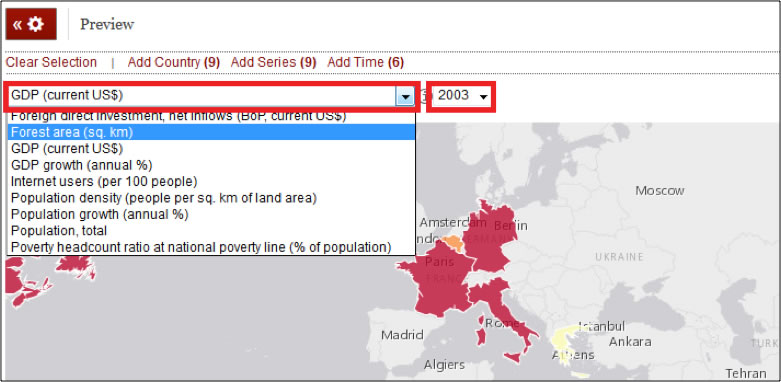
Note: A message ( There are five ways to select an indicator: Option 1: Scroll through the list in the Series section of the Variables tab, then check the boxes to indicate your selection.
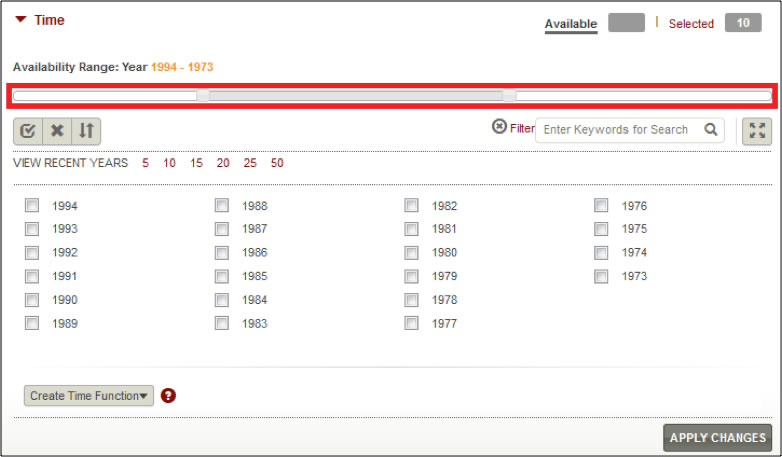
Option 5: Click on Add Series in the Preview panel of the Report page. This will open a new window containing the list of indicators. You can then make your selections using any of the first four methods mentioned above. There are four ways to select years: Option 1: Select the time span by using the year range slider in the Time section of the Variables tab.
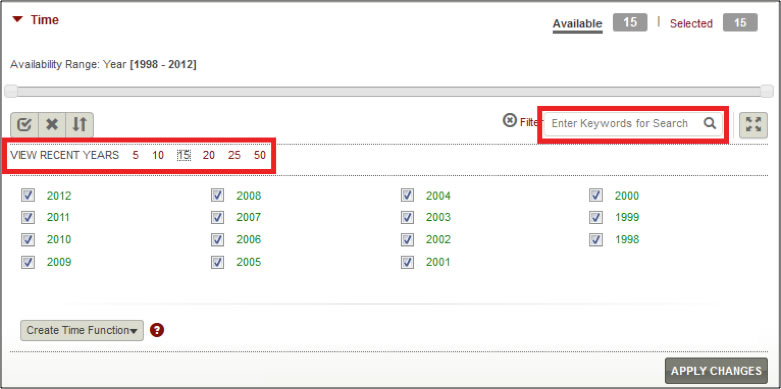
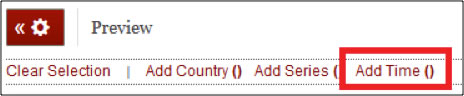
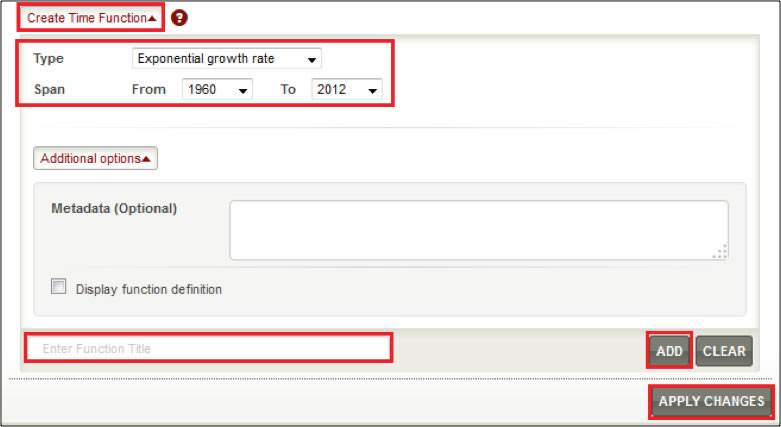
Option 2: Enter the year in the Search box, or use the filters: View Recent Years: 5, 10, 15, 20, 25, 50. Option 3: Click on Add Time in the Preview panel of the Report page. This will open a new window containing the list of years. You can then make your selections by using the year range slider, filter, or search box. How do I create a Custom Time Function? You can create a customized time function by clicking on Create Time Function. Enter a Title and select the parameters for the Type of operation and Span of years, then click Add.
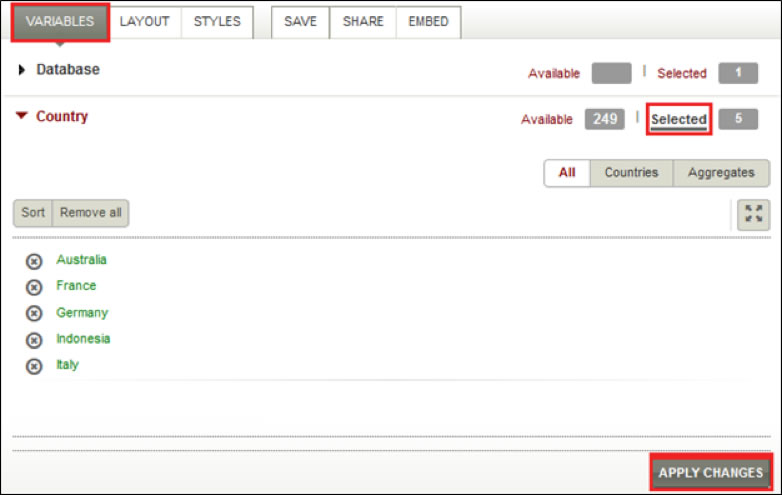
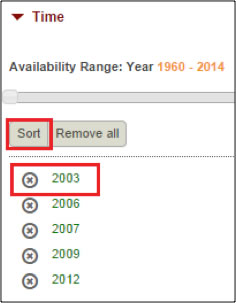
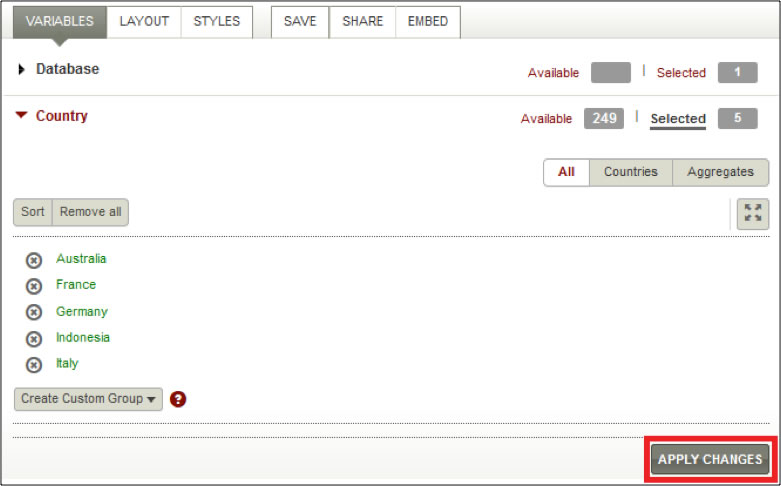
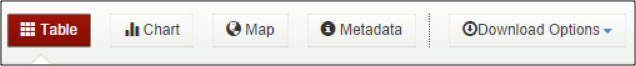
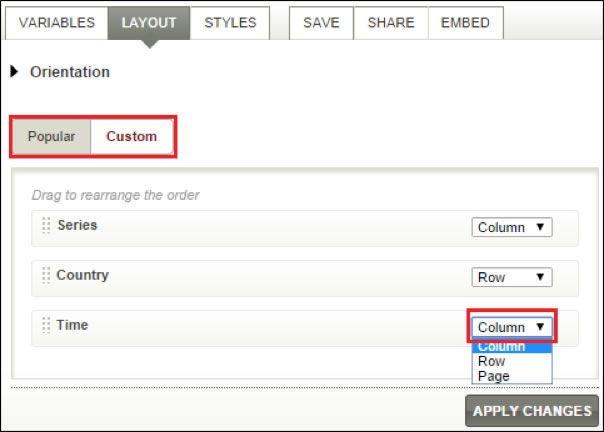
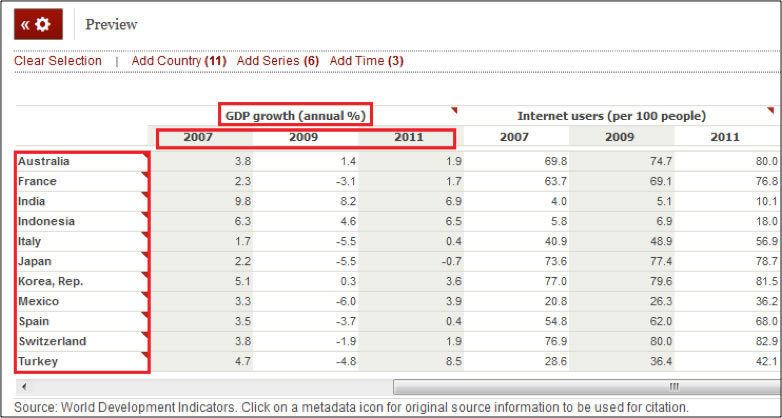
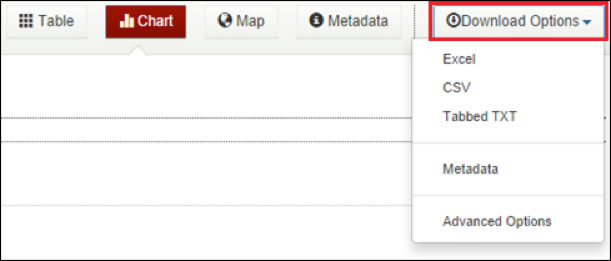
Note: The operation will be performed on all selected series and may generate inaccurate results (e.g., growth rates on current price series). Please observe caution when using this function. For more information on creating a time function, click on the "help" How do I edit the list of countries, indicators and years I have selected? You can edit your selections by clicking on Selected in the Country, Series, and Time sections of the Variables tab. How do I delete a country, indicator, or year from my selection? To delete anything from your selection list, click on the "x" to the left of the indicator, country or year. You can also click on Remove all if you wish to delete all the entries from your selection. How do I change the order of variables in the table or chart? There are two ways to do this: 1. Select the indicator, country or year and drag to rearrange the order. Click on Apply Changes when done editing. How do I view all the data I have selected? Any variable you select will not be reflected automatically. In order to view your data, click on Apply Changes. You can view the data as a Table, Chart, Map, or Metadata. You also have the option to download the data file in a number of formats (Excel, CSV, and Tabbed TXT). When you have finished making selections of countries, indicators and years, choose one of the viewing options on the toolbar on top of the page. Additional viewing options Why doesn't the table show all the data? By default the table shows the variables (country, indicator, time) by row, column, and page. To view the data for the variables in the page dimension, click and select from the dropdown menu.
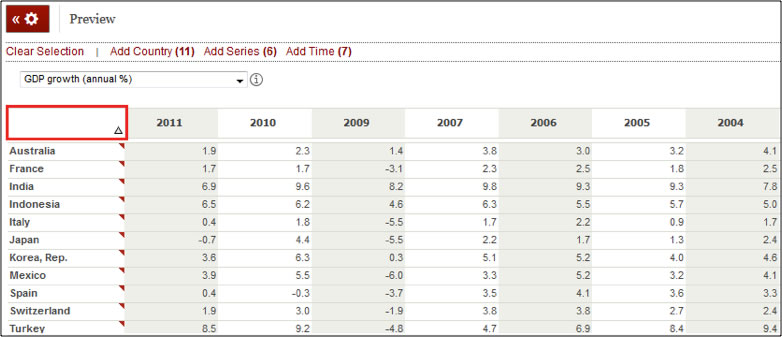
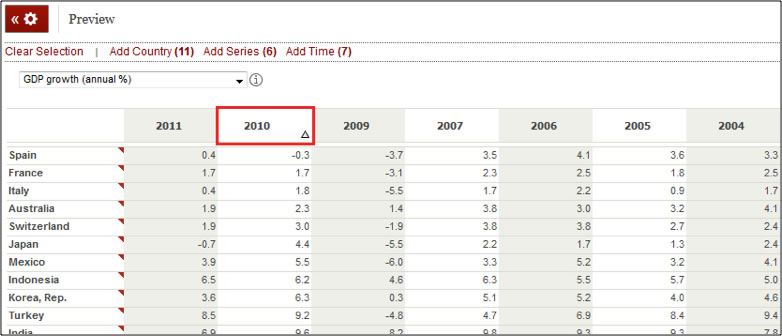
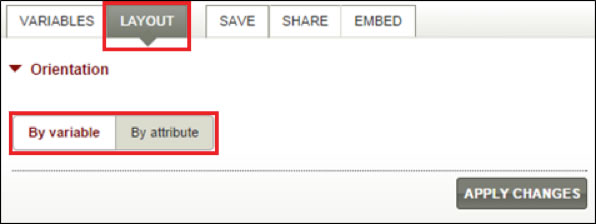
You can customize the way data is displayed by clicking on the Layout tab. Here you can change the data Orientation, increase or decrease the number of rows Displayed per page, Format Numbers, and add Table Headers and Footers. Once you have selected the changes you would like to make, click on Apply Changes. Table Orientation Click on Apply Changes for your changes to be reflected. Sorting data on your table You can also sort data numerically per year by clicking on the column header.
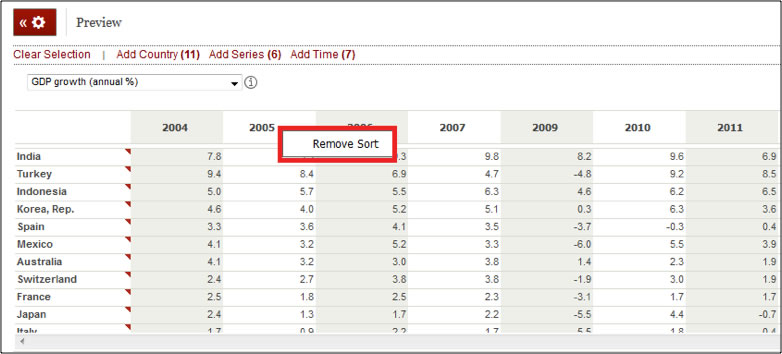
To remove sort, right-click on the column header and select Remove Sort.
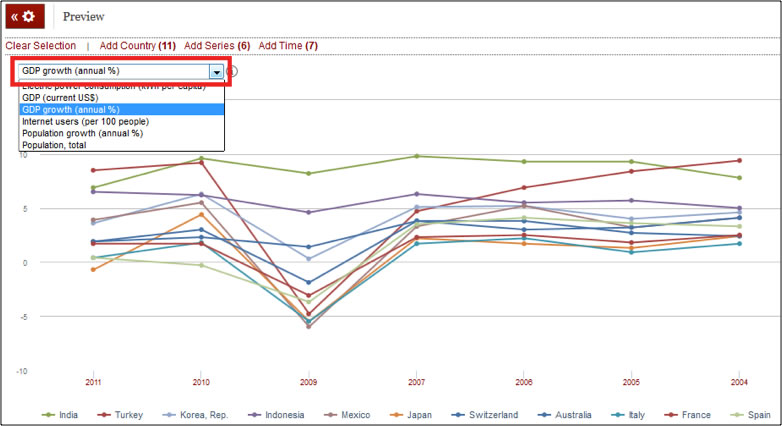
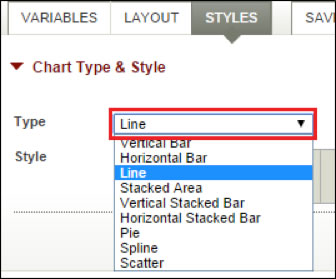
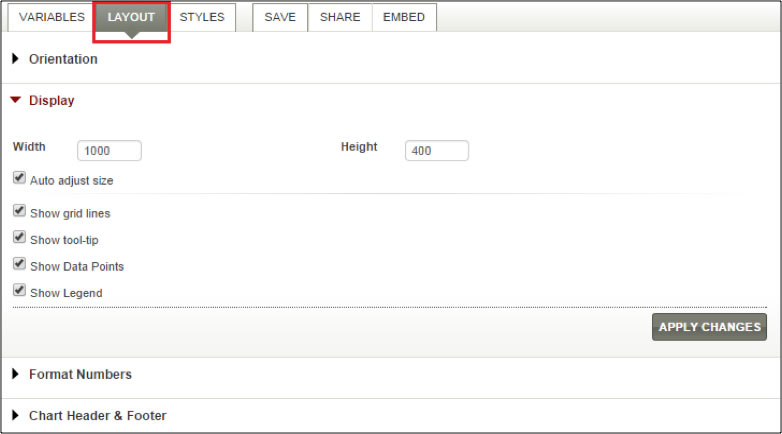
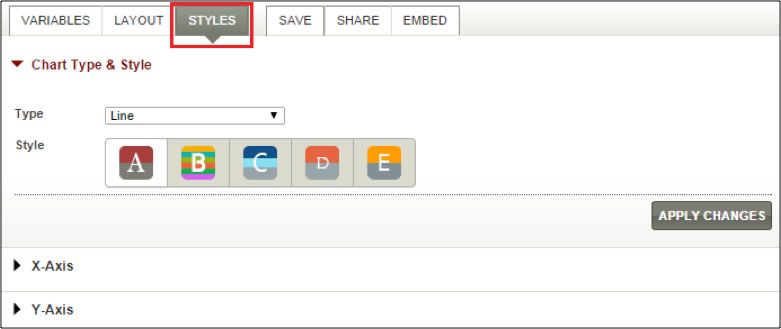
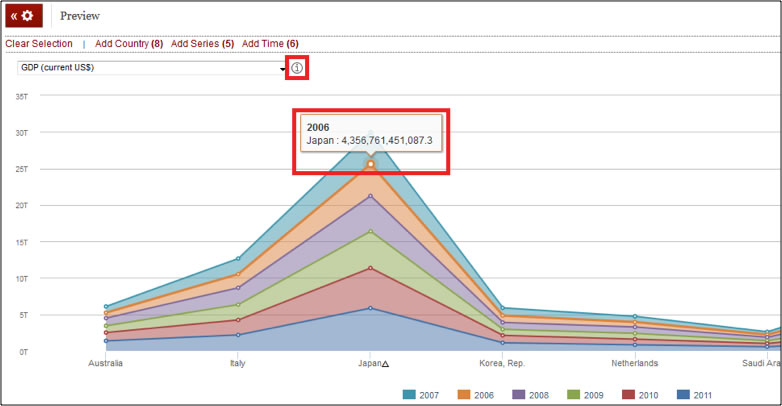
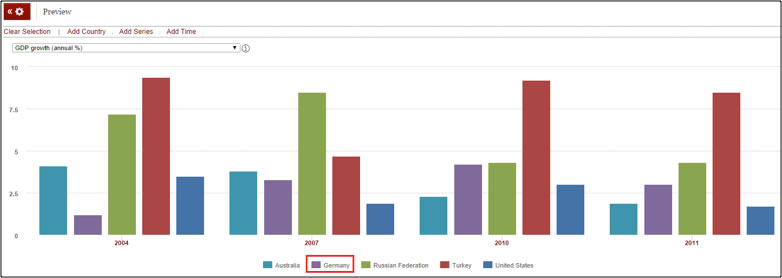
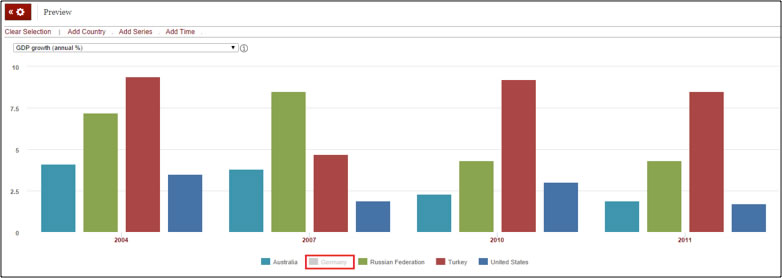
Why doesn't the chart show all the data? By default the chart shows the variables (country, indicator, time) by X-axis, Y-axis, and Page. To view the data for the variables in the Page display, click and select from the dropdown menu. How do I choose the type of Chart for visualizing my data? The default chart type is a line chart. You can change this by choosing from the dropdown menu located in the Chart Type & Style section of the Styles tab. Click on Apply Changes in order for the new chart to be displayed. You can customize the way data is displayed by clicking on the Layout tab. Here you can change the data Orientation, adjust the Display, Format Numbers, and add Chart Header & Footer. Once you have selected the changes you would like to make, click on Apply Changes. What are the other Chart customization options? The Styles tab lets you further customize the appearance of your chart. Here you can change chart style and color, as well as edit the way data is presented in the X-Axis and Y-Axis. How do I view metadata in a chart? Click on the "information" When viewing your chart, you can choose which data to include or hide by clicking on the Legend.
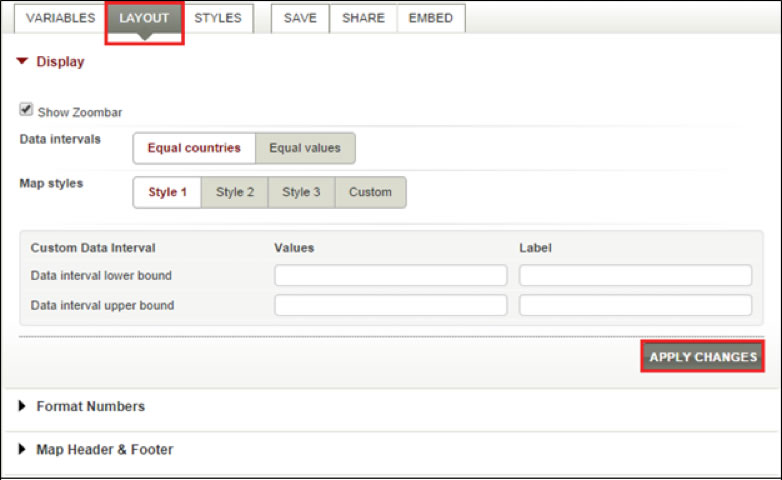
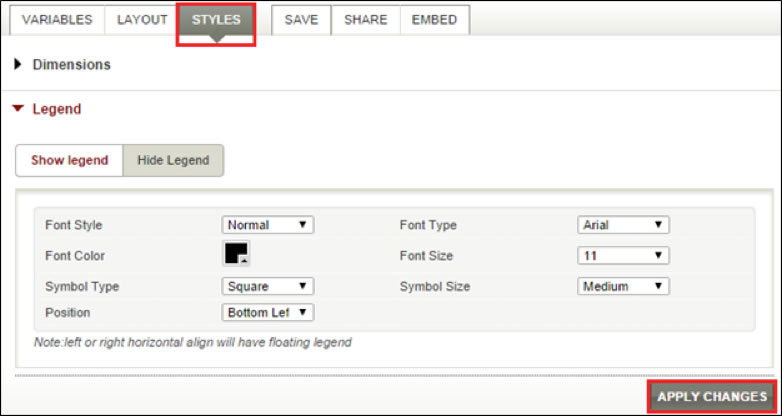
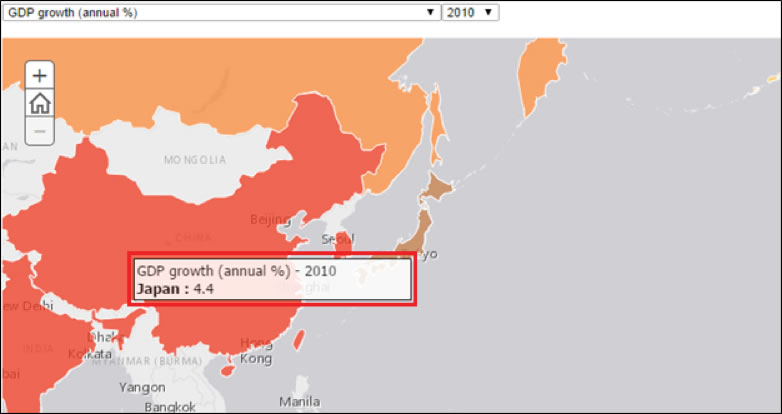
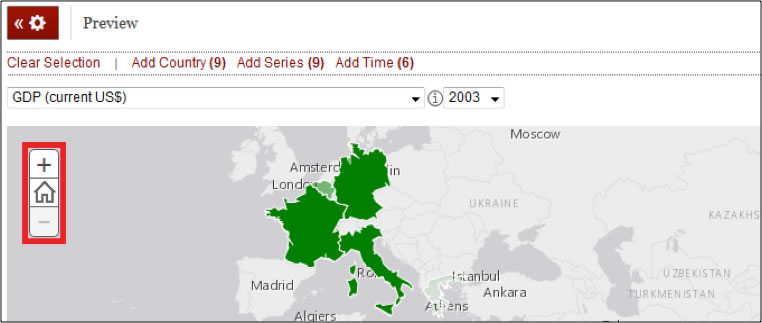
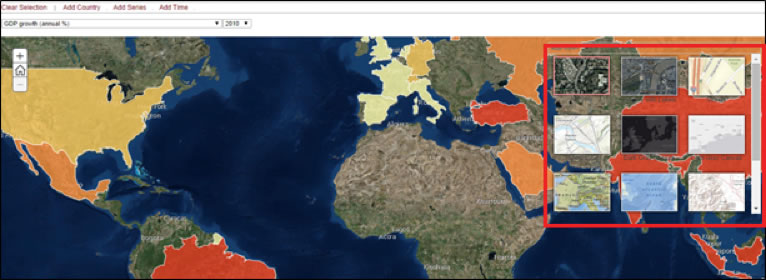
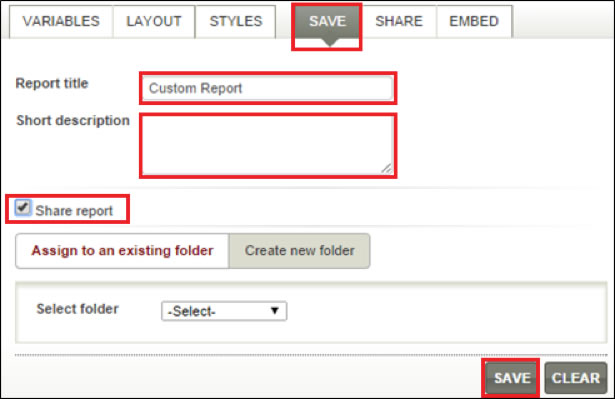
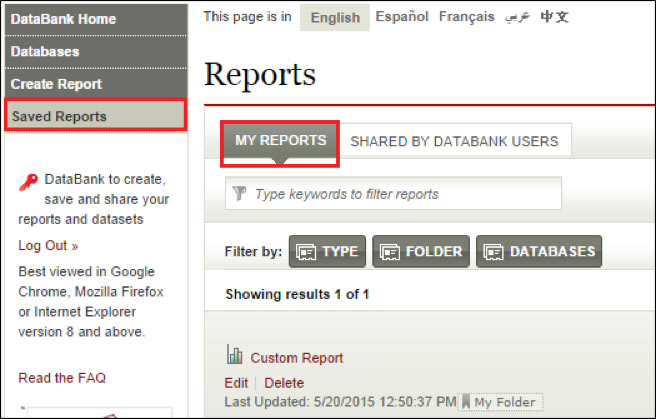
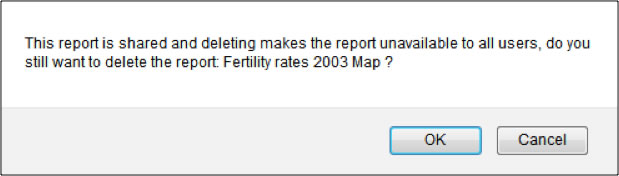
You can customize the way data is displayed by clicking on the Layout tab. Here you can change the Data Intervals, choose Map Styles, set a Custom Data Interval, Format Numbers, and add a map header or footer. Once you have selected the changes you would like to make, click on Apply Changes. You can also click on the Styles tab to further customize the appearance of your map. Here you can adjust the Dimensions and design the Legend. Once you have selected the changes you would like to make, click on Apply Changes. Viewing Data Viewing Additional Information Clicking on a country will generate the metadata. Navigating the map Changing the map display You can customize the way Metadata is displayed by clicking on the Layout tab. Here you can choose to view data By Variable or By Attribute. You can also choose the type of Metadata to be displayed in the Preview panel of the Report page by selecting from the dropdown menu. Use the text box on the right side of the page to perform metadata search. How do I edit my selections once I have the Table, Chart or Map open? You can always edit your selections while viewing your data. Just click on the Variables tab and go to the section you want to edit. Once you are satisfied with your edits, click on Apply Changes. Another way to edit your selections is by clicking on Add Country, Add Series, or Add Time in the Preview panel of the Report page. Clicking on these will generate a pop-up window where you can edit your selections. Once you are satisfied with your edits, click on Apply Changes. You can download the data to your computer by clicking on the Download Options from the toolbar. Select the format for your report (Excel, CSV, TXT, or SDMX) and it will automatically be downloaded. How do I save, access and delete my reports? Save Reports Access Saved Reports Delete Reports
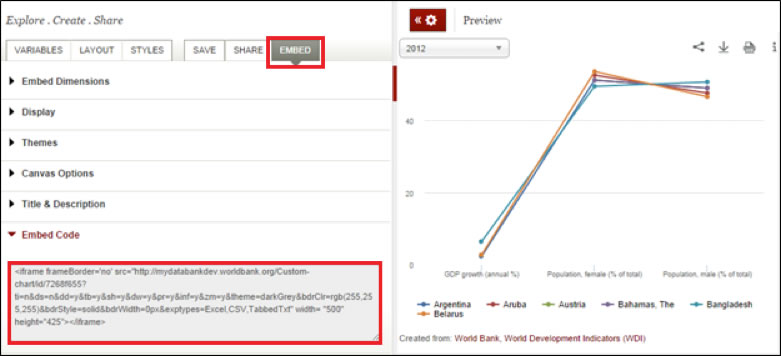
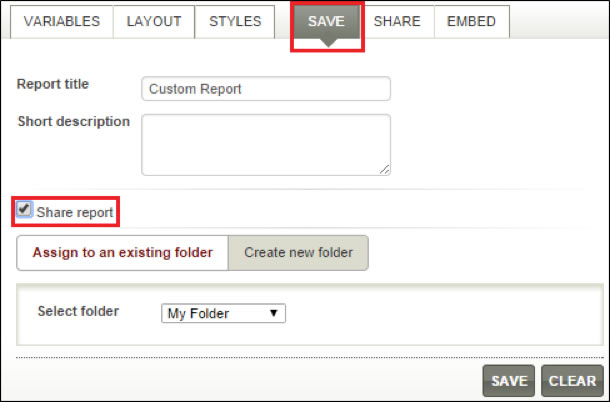
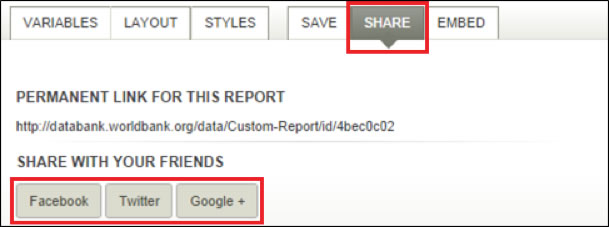
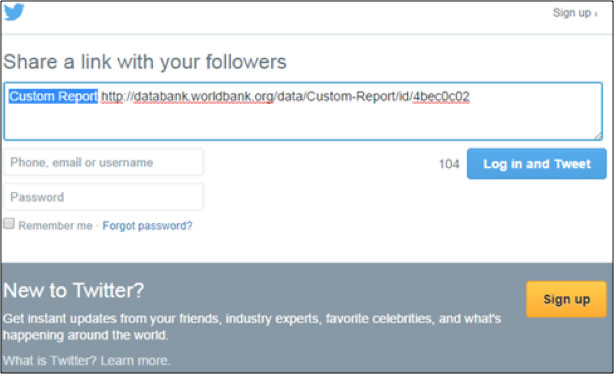
How do I embed tables, charts and maps? You can embed and customize your report by clicking on the Embed tab and setting the attributes (Display, Themes, Canvas Options, and Title & Description). When you are done, copy the embed code and drop it in the blog or website. While saving your report, save it with Share Report checked. Click on the Share tab and you will be provided with a link to your saved report. You can also share the report on Facebook, Twitter, and Google+ by clicking on their respective buttons. Clicking on the Facebook, Twitter, and Google+ buttons will open a new window where you can directly share your report in your chosen social media platform.
|
|