

Peace, justice, and strong institutions
The essential role of resilient and responsive institutions
SDG 16 aims to improve people’s lives by reducing violence, improving access to justice, and promoting effective, accountable, and inclusive institutions.
Strong, effective, transparent, and accountable institutions are essential for sustainable development and critical for governments to deliver services to their citizens. In 2020 governments worldwide have found themselves under strain while managing the fallout and consequences of the COVID-19 pandemic.
Government responses to COVID-19
In March 2020, as the rapid spread of COVID-19 became evident, many countries began to quickly implement containment and closure measures.
During a few short weeks in March 2020 almost the entire world shut down
Government Response Stringency Index
Note: The Stringency Index is a composite measure based on nine different response indicators. It varies from 0, or no measures, to 100, most restrictive measures. This index simply records the number and strictness of government policies and should not be interpreted as scoring the appropriateness or effectiveness of a country’s response.
Source: Hale, Webster, Petherick, Phillips and Kira. 2020. Oxford COVID-19 Government Response Tracker.
On March 1 only a few countries had introduced strict measures such as school and workplace closures and travel bans.
At that time China, Italy, and Mongolia were the only three countries with a combined stringency score—a measure of the strictness of lockdown-style policies—of 60 or higher on the Oxford COVID-19 Government Response Tracker.
Four weeks later, on April 1, the world looked entirely different. Of 180 countries being tracked, 153 had introduced measures with a combined stringency score of 60 or higher. Almost all countries closed schools and recommended workplace closures.
A devastating but unequal global economic crisis
The shutdowns had an immediate negative impact on the economy. Large numbers of people were thrown into unemployment and economic uncertainty.
Daily fiscal actions spiked in March and April
January–September 2020
Note: Based on data from 109 countries.
Source: Yale School of Management. 2020. COVID-19 Financial Response Tracker.
To counteract this economic crisis countries around the world introduced fiscal measures at an unprecedented pace. According to The Yale School of Management's Program on Financial Stability, 109 countries introduced a total of 3,000 fiscal actions in March and April alone, a large spike compared with the pace of previous months.
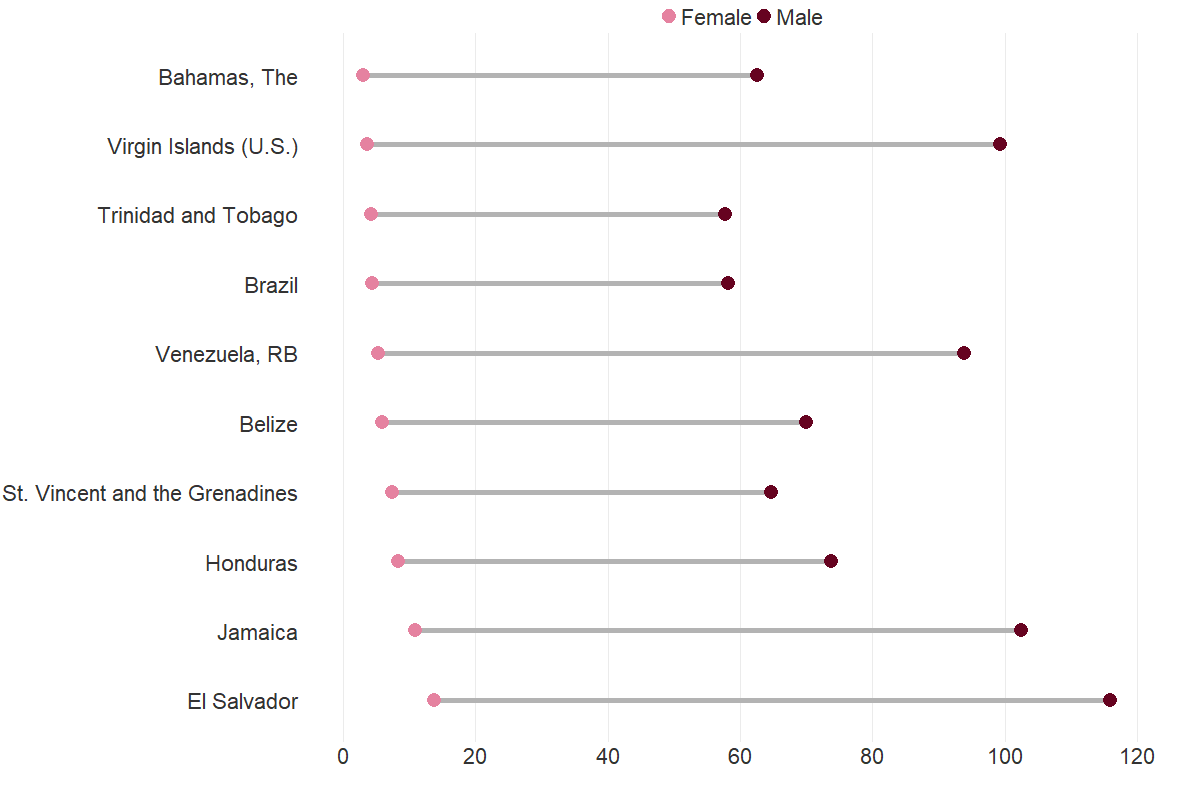
Rich countries have spent much more than poor countries in response to the current economic crisis
Economic stimulus as a percentage of GDP, as of August 12, 2020
Note: Figures included both monetary and fiscal measures. Economic stimulus estimates are based on the ODI country policy response tracker. GDP data have been collected from World Development Indicators and the UN (for South Sudan only).
Source: Overseas Development Institute. 2020. Country Policy Responses to COVID-19, as of 12 August 2020.
The willingness of governments to respond with swift measures shows how governments and central banks can act decisively in a crisis.
Effective institutions
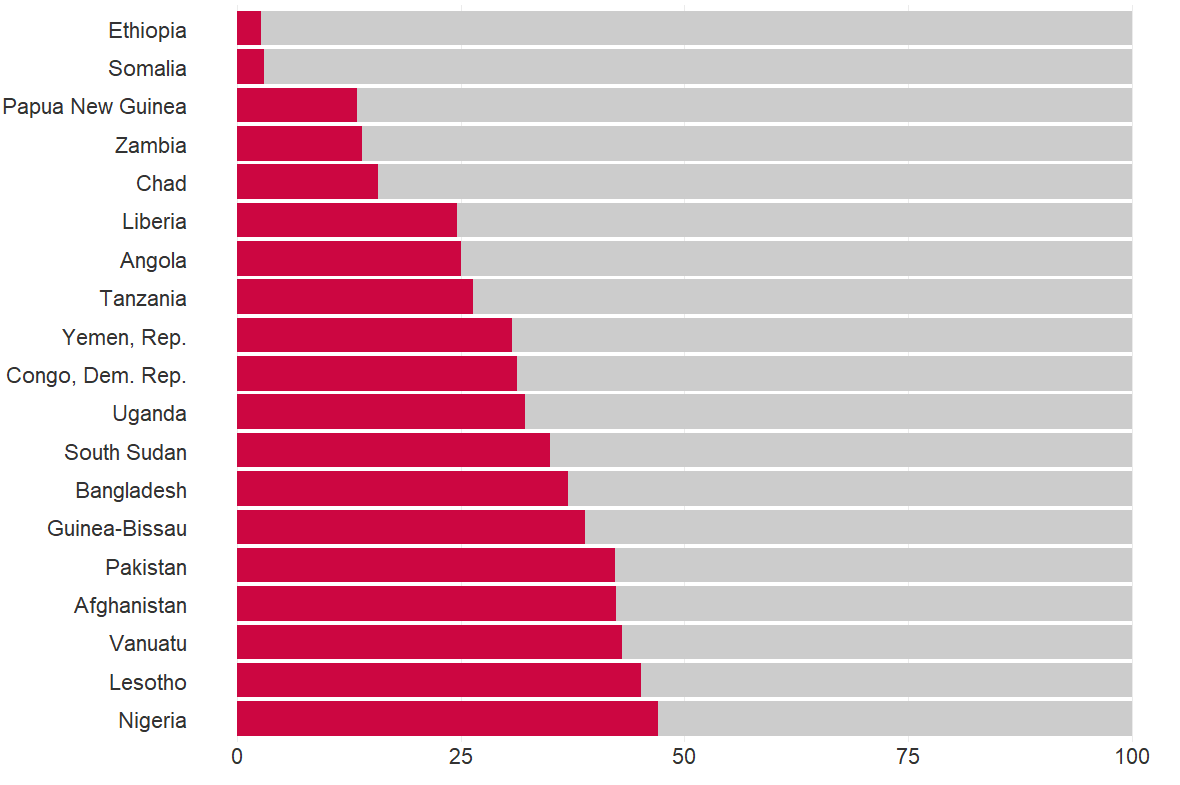
The Worldwide Governance Indicators (WGI) measure performance on government effectiveness, among other governance indicators, using enterprise, citizen and expert surveys around the world. The indicator on effectiveness attempts to capture the quality of public service, the quality of the bureaucracy, and the quality of policy formulation and implementation.
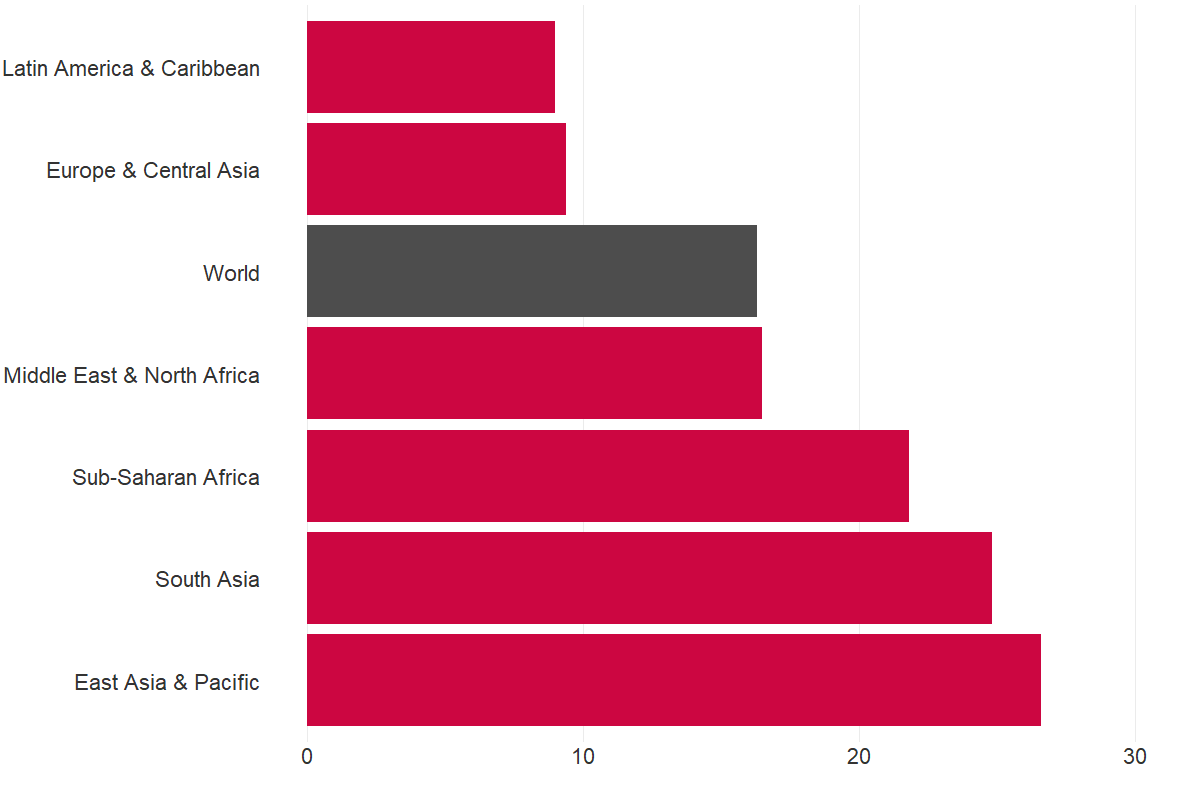
All countries are scored on a scale from 0 to 100, based on their relative performance compared to other countries. In Sub-Saharan Africa, 28 out of 48 countries are in the lower quartile of effectiveness, with a small number of countries in other regions also in this range.
Lack of Government Effectiveness is most pressing in Sub-Saharan Africa
Government Effectiveness, percentile range, 2019
Note: WGI defines Government Effectiveness as “perceptions of the quality of public services, the quality of the civil service and the degree of its independence from political pressures, the quality of policy formulation and implementation, and the credibility of the government's commitment to such policies”.
Source: Worldwide Governance Indicators. 2020.
The WGIs are based on how survey respondents in different countries perceive different aspects of the quality of their institutions. These perceptions do not necessarily imply that the local institutions are of corresponding quality or that they haven’t changed over time.
Surveys that look at satisfaction with institutional performance in specific areas are useful in that they provide policymakers with important insights into how people perceive the quality of government services. Satisfaction with public services is one such indicator for SDG target 16.6, which focuses on effective, accountable, and transparent institutions.
The most recent survey by the Afrobarometer asked people in 34 African countries how well their government handles improving basic health services. In Botswana and Kenya more than two-thirds of respondents said that their current government was doing fairly or very well, while in several other countries respondents had less favorable views of the health services they receive.
Satisfaction with the improvement of basic health services varies widely between countries
How well would you say the current government handles improving basic health services (%)
Source: Afrobarometer (Round 7 2016/2018).
Budget management
To evaluate the institutional quality of governments, we can examine how they perform in practice. One way to do this is to assess whether governments adhere to their planned budgets. This is a key indicator used to measure effective, accountable, and transparent institutions for SDG target 16.6.
The Public Expenditure and Financial Accountability (PEFA) Program, hosted by the World Bank, assesses countries' financial management of public expenditures. As part of this process, PEFA collects data on a government's total expenditure as a proportion of its originally approved budget (SDG indicator 16.6.1).
Overspending and underspending undermine budget credibility
Difference between original approved and actual government budget, 2005-19
Note: Based on 68 countries with 10 or more observations during 2005–19. Data are derived from primary government expenditures as a proportion of original approved budget.
Average budget deviations vary a lot across countries. Some countries, such as Colombia, Moldova, and Norway, spend close to their planned budgets, while others spend much more or much less.
But averages do not tell the whole story. Even when a country's spending is, on average, close to the planned budget, year-to-year variations can be large. For example, Moldova spent nearly 16 percent more than its planned budget in 2007 but almost 9 percent less than originally planned in 2015.
Such yearly fluctuations are why PEFA uses a period of three years when conducting their evaluations. Countries that deviate by more than 15 percent from their planned budget once within a period of three consecutive years are classified as a C, while countries that deviate more than 15 percent in two or more years over the three-year period receive a D grade.
Some countries have improved budget reliability; others have regressed
First and last Public Expenditure and Financial Accountability grade for budget reliability, 2005–19
Note: PEFA 2011 methodology. Each arrow or dot reflects the change in a country’s grade. Based on 71 countries with multiple public assessments during 2005–19. Assessments measure how much actual expenditure deviates from budgeted expenditure during a period of three years. See PEFA's 2011 PFM Performance Measurement Framework for details.
Source: Public Expenditure and Financial Accountability (database).
Of 71 countries with multiple PEFA assessments, 32 improved their grade from the first to the most recent assessment.
Some economies did so substantially—for example, Georgia moved from a D in 2008 to an A in 2018.
However, 23 countries—a third of those assessed—saw their grade decline, illustrating that budget control requires continuous effort.
Transparency and accountability
Good financial management encompasses more than budget reliability. The broader aim of SDG target 16.6 is for institutions to be both transparent and accountable.
One crucial aspect of financial management is the public’s access to fiscal information from the government. Another is the degree to which the supreme audit institution (SAI) operates independently from the executive branch. A supreme audit institution is a government institution that conducts audits of government activities, monitors the use of public funds and serves as a public spending watchdog. Both public access to information and independent auditing are essential to ensuring a transparent budget process and holding the government accountable for its spending.
A third aspect is the ability to prepare fiscal forecasts. Such forecasts make budget allocations more predictable and are needed to assess the fiscal impact of the government’s policies. To ensure transparency, forecasts and their underlying assumptions should also be submitted to the legislature.
Few countries perform well in all three aspects of public financial management. Of the 49 countries that have been assessed since 2016 only 9 received an A or B grade on all three indicators.
Few countries perform well in all areas of public financial management
Public Expenditure and Financial Accountability grades for public access to information, independence of the supreme audit institution, and fiscal forecasting
Note: PEFA 2016 methodology. Based on 51 public assessments during 2016–20, in total covering 49 countries. See PEFA's 2016 Framework for assessing public financial management for a detailed overview of the methodology for each indicator.
Source: Public Expenditure and Financial Accountability (database).
Indonesia (in 2018) received an A on public access to information, while also scoring a B on fiscal forecasting and a B on independence of the supreme audit institution.
Ghana (in 2018), on the other hand, received an A on both public access to information and SAI independence, while scoring a C on fiscal forecasting.
While Argentina (in 2019) received an A for independence of the supreme audit institution, a B for public access to information, and a C on fiscal forecasting. The C grade implies that the government prepared forecasts but did not submit them to the legislature.
Institutions need to be transparent, accountable and effective to function properly and cope with crises such as the COVID-19 pandemic. For many governments the crisis may help identify weaknesses in current institutions and present an opportunity to make structural improvements.
Learn more about SDG 16: Peace, justice and strong institutions
Swipe for the next chart
Notes
- Hale, T., N. Angrist, E. Cameron-Blake, L. Hallas, B. Kira, S. Majumdar, A. Petherick, T. Phillips, H. Tatlow, and S. Webster. 2020. Oxford COVID-19 Government Response Tracker. Blavatnik School of Government. ↩
- World Bank. 2020. Global Economic Prospects, June 2020. Washington, DC.↩
- IMF (International Monetary Fund). 2020. “The Global Economic Reset - Promoting a More Inclusive Recovery” (June 11). ↩
- South Africa is grouped with other G20 countries, but is included in the calculation of average stimulus funding for both G20 countries and Sub-Saharan African countries. ↩
- Kaufmann, D., A. Kray, and M. Mastruzzi. 2010. “The Worldwide Governance Indicators: Methodology and Analytical Issues”. Policy Research Working Paper 5430. World Bank, Washington, DC.↩
- Afrobarometer. 2019. Round 7, 2016/2018. Merged Round 7 data (34 countries).↩
- UNODC. 2019. Global Study on Homicide 2019. Vienna.↩