
Decent work and economic growth
Increasing productivity and reducing vulnerable employment
SDG 8 aims to promote economic growth and decent work for all. Economies grow when more workers have access to jobs and when workers are more productive.
The COVID-19 pandemic has considerably impacted employment opportunities in countries around the world. In January 2020, before the pandemic, global GDP was projected to grow by 2.5 percent in 2020; in June 2020 it was projected to contract by 5.2 percent, with even steeper contractions in some regions. That would mark the deepest recession in eight decades.
Global GDP is projected to fall by the largest amount since at least the 1970s
Source: World Bank. Global Economic Prospects, January 2020: Slow Growth, Policy Challenges.
Over the near term, restoring employment will be critical to growing economies. Restoring progress in access to well-paying jobs for women, young people, and persons with disabilities will be particularly important because these groups have typically had lower labor force participation rates and lower earnings (SDG target 8.5).
But returning to the status quo will not be enough to achieve SDG 8. Improving worker productivity will be key as well. Worker productivity is closely related to how much workers earn and GDP (SDG target 8.1 and target 8.2).
Gdp growth strongly correlates with productivity growth
Gdp growth vs productivity growth, 3-yearly moving averages 1993-2018
Source: World Development Indicators (NY.GDP.MKTP.KD.ZG, SL.GDP.PCAP.EM.KD)
These are the yearly growth rates for GDP and productivity of 217 economies from 1990 to 2019. A strong positive correlation exists between productivity growth (on the vertical axis) and GDP growth (on the horizontal axis).
These are the yearly growth rates for China between 1993 and 2018. When worker productivity grows, GDP tends to grow as well.
Hover over a dot or select a country from the dropdown list to see the country's trajectory.
Using averages over 2010–18 for each country can remove some of the “noise” in the data and highlight recent progress. The bubble size indicates the size of the population in 2018. From 2010 to 2018 worker productivity tended to increase along with GDP.
There are many ways to improve work productivity including by building human capital through improvements to education and health, by improving infrastructure, and by applying new technology (SDG target 8.2). Another, and the focus of the remainder of this chapter, is economic transformation.
Economic transformation
To grow over the long term, economies need to transform in a way that promotes high-productivity work (SDG target 8.2 and target 8.3). Among low-income economies, those that transitioned from low-productivity sectors to high-productivity sectors accounted for over two-thirds of total productivity growth. This has generally meant shifting from low- to high-productivity agriculture, toward urbanization, and away from vulnerable employment.
Gdp growth strongly correlates with productivity growth
Gdp growth vs productivity growth, averages 2010-2018
Source: World Development Indicators (NY.GDP.MKTP.KD.ZG, SL.GDP.PCAP.EM.KD, SL.AGR.EMPL.ZS, SP.URB.TOTL.IN.ZS, SL.EMP.VULN.ZS)
As shown above, GDP growth tends to rise with productivity growth. Successful transition to higher productivity sectors often comes with greater agricultural productivity.
Agriculture remains the dominant industry in many low-income countries. In 2019 agriculture accounted for 60 percent of employment in low-income countries compared with only 3 percent in high-income countries. However, for most countries the share of agriculture in employment has been falling as shown in the chart.
As agricultural productivity rises, the share of employment in agriculture tends to fall because fewer hands are needed to perform agricultural work. Workers often then migrate to urban areas, taking manufacturing and service sector jobs. In 1990 around 40 percent of the world’s people lived in urban areas; in 2019 almost 60 percent did.
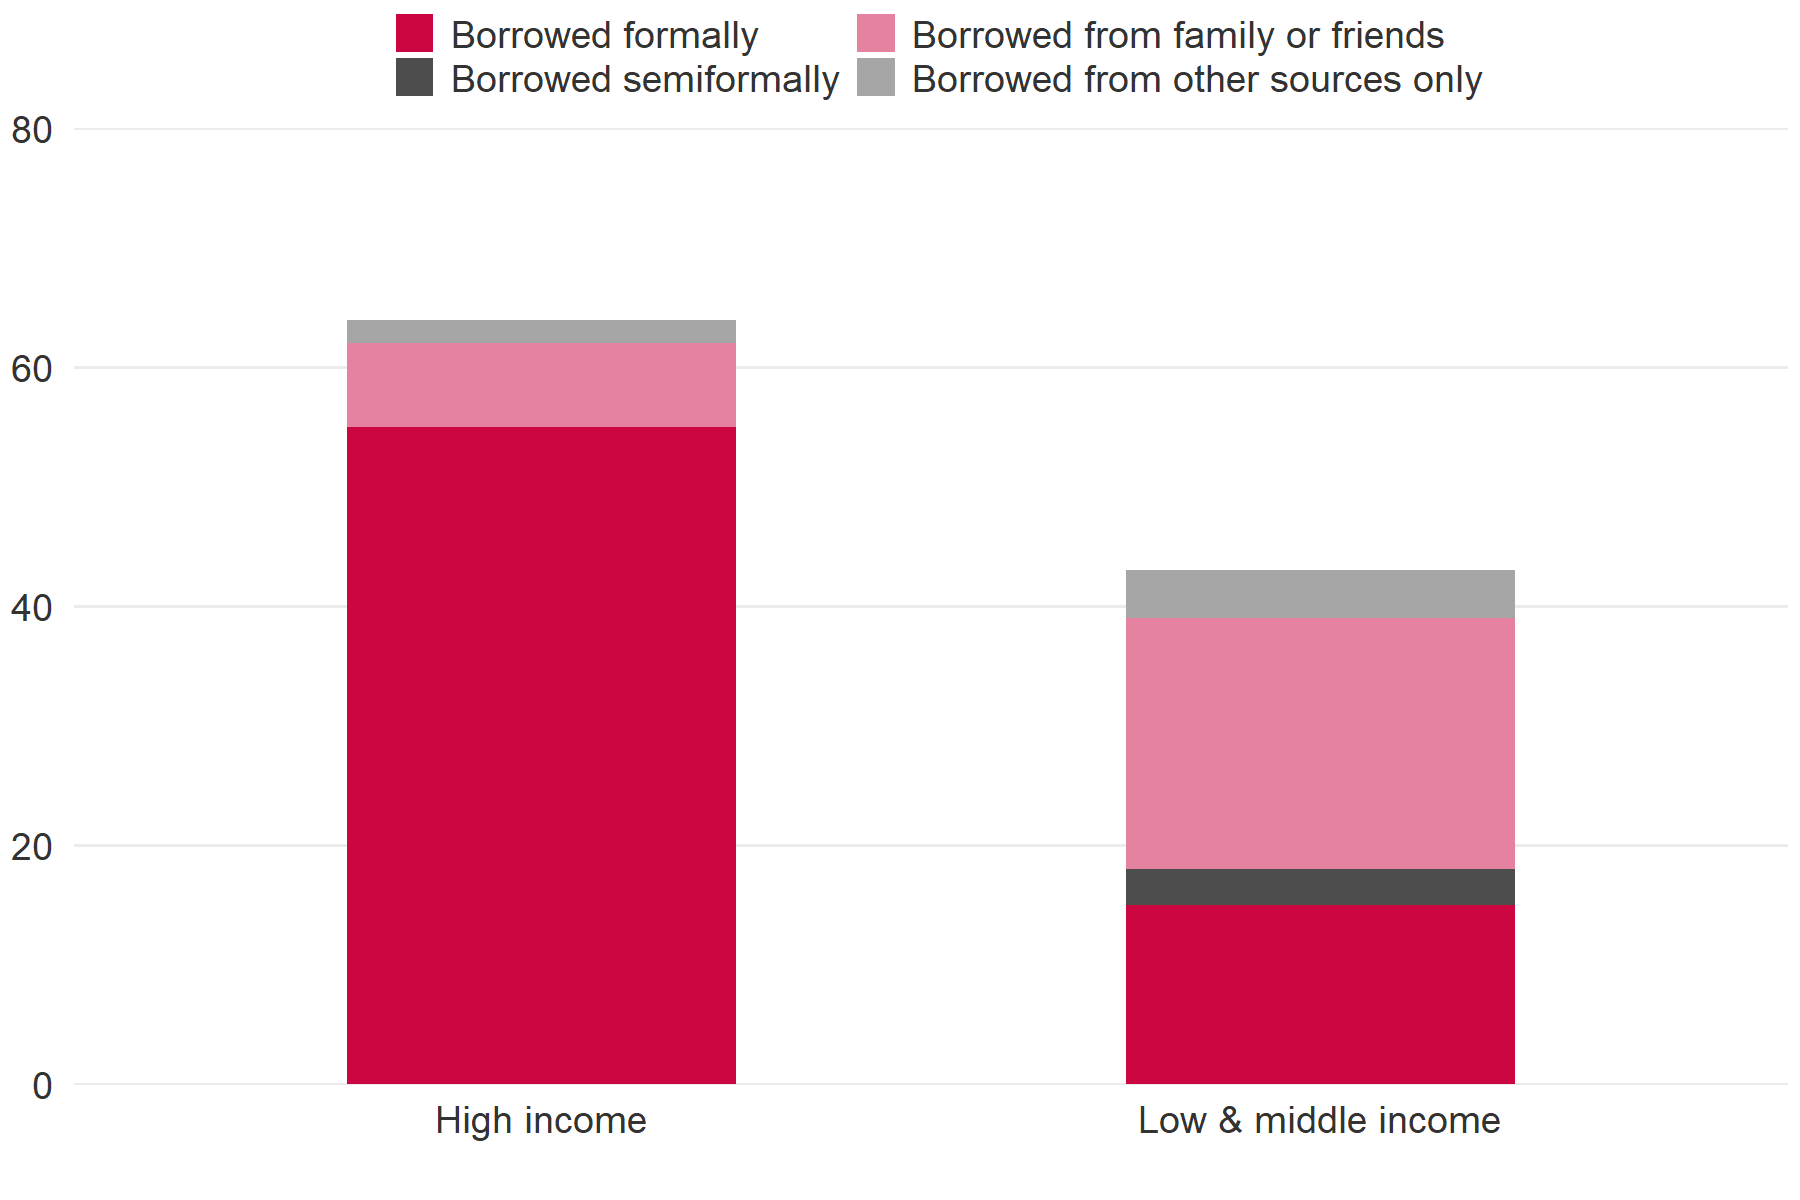
Another part of successful economic transformation is reducing vulnerable employment, where workers lack formal work arrangements and are self-employed or work for their family (SDG target 8.3 and target 8.8). In low and middle income economies, informal workers are only 15 percent as productive as formal workers. As countries grow, vulnerable employment tends to fall as a share of total employment.
The share of workers in agriculture, the share of the population in urban areas, and the share of vulnerable workers has shifted markedly since the early 1990s. Globally, the share of workers in agriculture has dropped from just over 40 percent in 1991 to just over 25 percent in 2019. The share of the population in urban areas has grown from a little over 43 percent in 1991 to around 55 percent in 2019. And the share of vulnerable workers has shrunk from over 53 percent in 1991 to under 45 percent in 2019. More progress is needed, particularly in vulnerable employment.
Changes in the economy
Source: World Development Indicators (SL.AGR.EMPL.ZS, SP.URB.TOTL.IN.ZS, SL.EMP.VULN.ZS)
Reducing the share of workers in vulnerable employment has taken on new urgency with the COVID-19 pandemic. Vulnerable workers are affected by the pandemic in two ways. First, many have jobs that are highly exposed to the economic impacts of COVID-19. Own-account workers and micro-enterprise workers, considered to be vulnerable workers, account for 70 percent of global employment in the retail trade and 60 percent of employment in accommodations and food services. Second, vulnerable workers rarely have access to social protection and labor programs to help weather job losses during the pandemic (SDG target 8.b).
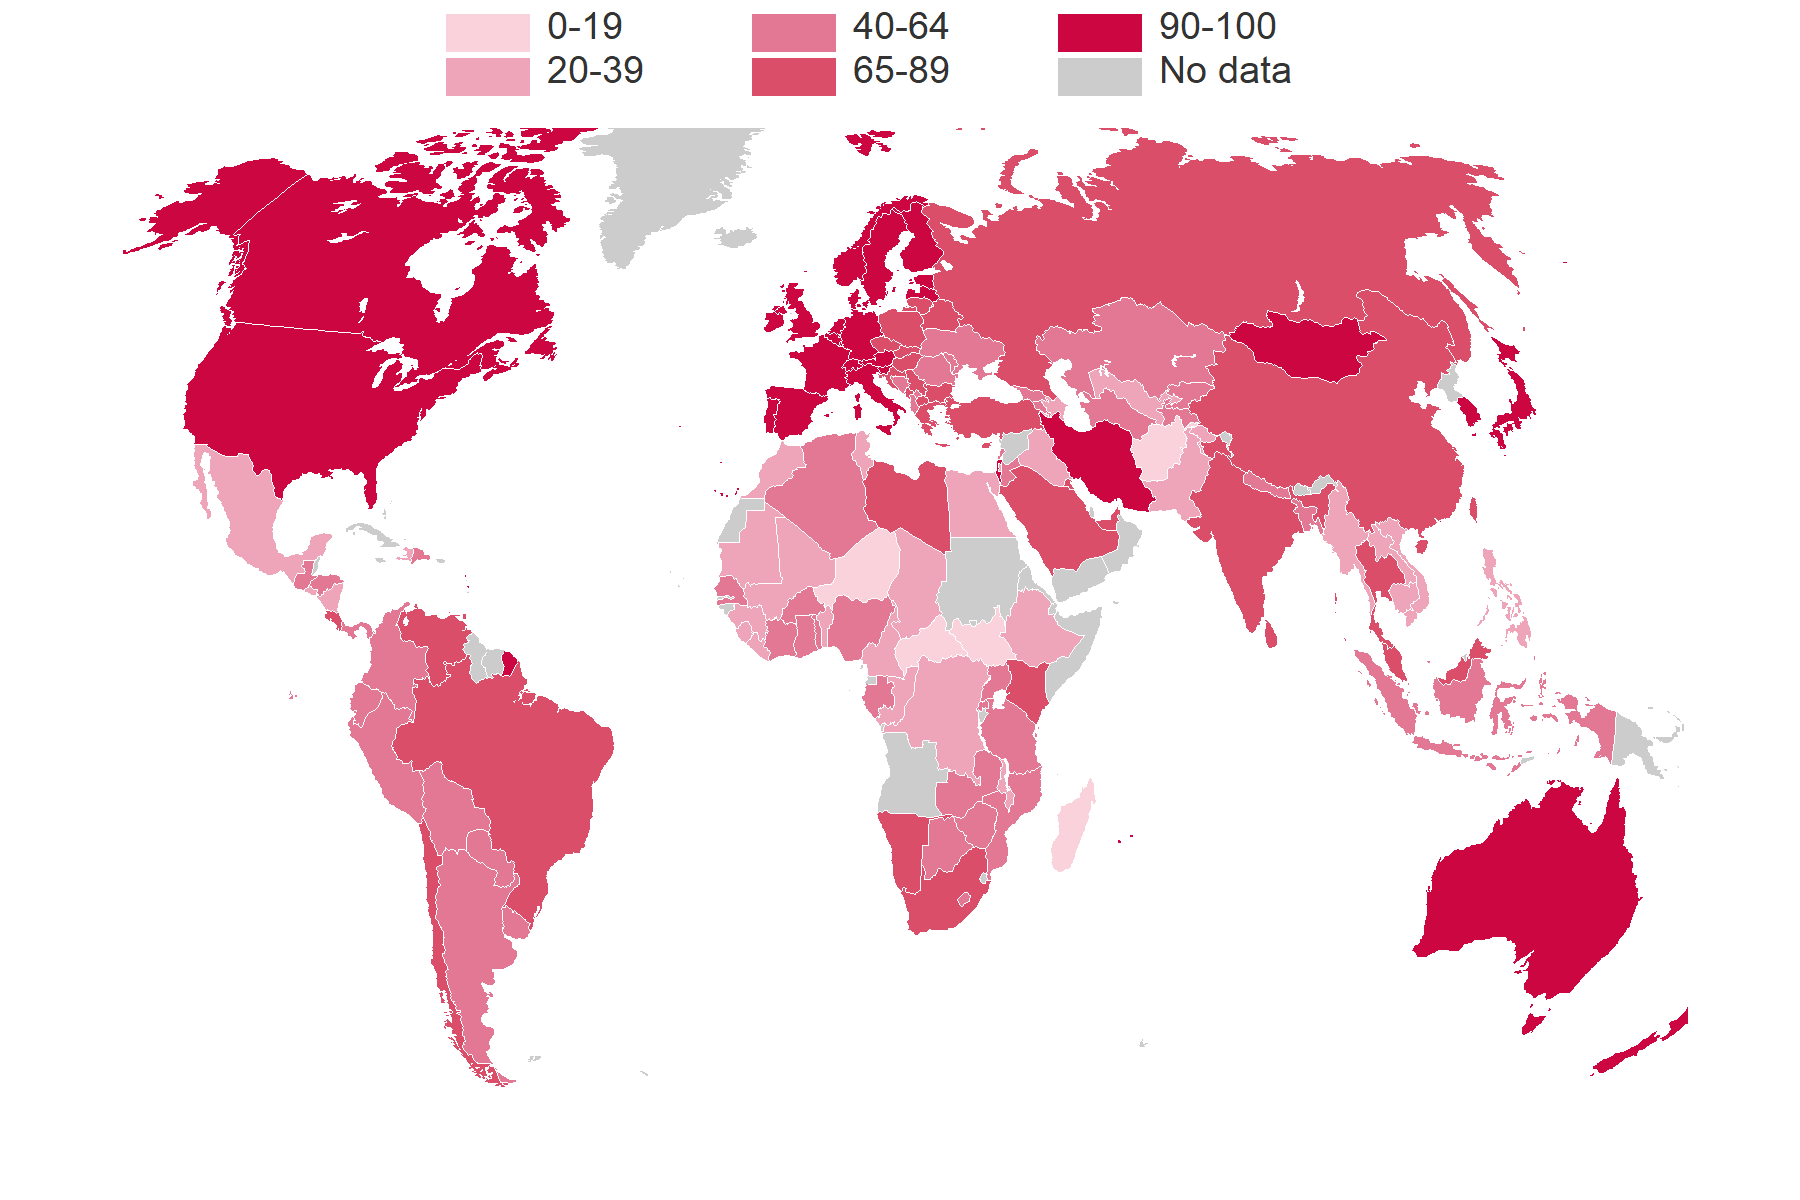
Women and young people are particularly susceptible to the effects of the pandemic (SDG target 8.5). According to a report by the ILO, women are more exposed than men to job losses due to COVID-19: 42 percent of female workers are in highly impacted sectors compared with 32 percent of men. And 77 percent of young workers are in informal jobs compared with 60 percent of adult workers. The rate of vulnerable employment among young workers is over 95 percent in low and lower middle income countries.
Vulnerable employment is more likely among youth workers (ages 15–24)
Vulnerable employment (% of total employment)
Source: ILO. ILO Monitor: COVID-19 and the world of work. Fourth edition.
Since the 1990s economies have greatly transformed, and GDP growth has followed. Further progress is needed in other dimensions, including improving opportunities for younger workers (SDG target 8.6); eradicating forced labor, modern slavery, and human trafficking (SDG target 8.7); boosting sustainable tourism (SDG target 8.8); expanding access to banking, insurance, and financial services (SDG target 8.10); and increasing aid for trade support (SDG target 8.a).
Learn more about SDG 8: Decent work and economic growth
Swipe for the next chart
Notes
- World Bank. 2020. Global Economic Prospects, January 2020: Slow Growth, Policy Challenges. Washington, DC: World Bank. ↩
- Merotto, Dino; Weber, Michael; Aterido, Reyes. 2018. Pathways to Better Jobs in IDA Countries : Findings from Jobs Diagnostics. Jobs Series;No. 14. World Bank, Washington, DC. © World Bank. License: CC BY 3.0 IGO. ↩
- The definition for the share of vulnerable employment is contributing family workers and own-account workers as a percentage of total employment. https://data.worldbank.org/indicator/SL.EMP.VULN.ZS ↩
- World Bank. 2019. World Development Report 2019: The Changing Nature of Work. Washington, DC: World Bank. ↩
- ILO Monitor: COVID-19 and the world of work. Third edition. April 29,2020. ↩