Data
Global Consumption Database
Tables, Charts and Technical Notes
Data presented in the tables are World Bank estimates based on national household consumption or expenditure survey datasets. All surveys used have a nationwide coverage. The tables present data from the Global Consumption Database on a range of topics and levels of detail. To view these data, select from the options in the drop-down menu below. A detailed description of the goods and services included in each sector and category is provided here.
Data presented in the charts are World Bank estimates based on national household consumption or expenditure survey datasets. All surveys used have a nationwide coverage. The charts present data from the Global Consumption Database. To view these data, select from the options in the drop-down menu below.
Data presented in the tables and charts are World Bank estimates based on the national household consumption or expenditure survey datasets listed below.
All surveys used have a nationwide coverage. Their sample size ranges from less than 2,000 households to more than 100,000. The universe of each survey is composed of ordinary households only; “institutional households” (prisons, military barracks, hospitals, convents, and others) are not covered by household surveys. Homeless and nomadic populations and visitors present in a country during a survey are also excluded from the sample.
Few developing countries conduct household consumption or expenditure surveys on an annual basis. International organizations recommend conducting such surveys every three or four years. The surveys used in the database were conducted between 2000 and 2010 (except the one for Djibouti, which was conducted in 1996); most were conducted during the period 2007–10. All data presented in the Global Consumption Database are as of 2010. When based on a survey conducted before 2010, the estimates were obtained by extrapolation, as described in the notes on the standardization of data (see Step 4).
Household survey datasets are complemented by data on population, purchasing power parity (PPP) conversion factors, and average exchange rates obtained from the World Bank’s World Development Indicators database.
Because of the diversity of methods and instruments used by the surveys, comparability across countries is limited. Survey questionnaires are provided below as an important metadata component. Links are also provided to the microdata when available.
| Country Name | Survey Title | Questionnaire | Link |
|---|
The Global Consumption Database draws on a diverse set of surveys. The data were standardized to the extent possible, through the six-step process described below.
Step 1: Annualizing consumption or expenditure data
The first step consisted of annualizing each household’s consumption or expenditure data for each commodity (the data are nominal values in local currency; no regional price deflators were applied).
In some cases annualization is straightforward and consists simply of applying a multiplying factor to the data, which is determined by the “recall period” (the period on which households are asked to report by recalling their expenditure during that period). (For example, food data collected “for the past 7 days” would be divided by 7, then multiplied by 365; monthly values would simply be multiplied by 12.) This is the method used for most purchased food products and regularly purchased nonfood products and services.
Annualization becomes more complex for home-produced and received goods and services, for which consumption values have to be calculated on the basis of data on quantities consumed and local (farm-gate or factory-gate) prices.
Another challenge in annualizing data is that quantities are not always reported in metric units and not all countries provide conversion factors for nonstandard measurement units.
Two consumption items are typically problematic: imputed rents and use value of durable goods.
- Imputed rents. A rental value may be imputed for owner-occupied dwellings, through a process using hedonic regression models. But because the rental market is often very limited in developing countries, especially in rural areas, this process can be difficult and often produces unrealistic estimates.
- Durable goods. Some surveys are intended to measure expenditure and collect data on purchases of durable goods with a recall period of one year. In these cases no annualization is needed. Many other surveys seek to measure consumption, not expenditure. In these cases an annual use value of the durable goods is calculated through the use of depreciation rates—a process that requires information, not always available, on the date and price of purchase and the estimated resale value (see Angus Deaton and Salam Zaidi, “Guidelines for Constructing Consumption Aggregates for Welfare Analysis,” Living Standards Measurement Study Working Paper 135, World Bank, Washington, DC, 2002).
Step 2: Detecting and fixing outliers
The second step was to detect and fix outliers. All datasets obtained from countries contain “outlying” expenditure values.
There are two types of such outliers: those that indicate “big spenders” (rich households), which are valid values and should not be removed or changed, and those that are a result of errors in data collection (reporting), data coding, or data entry, which need to be fixed.
Expenditure data can be unrealistically high or low. Unrealistically low values, i.e. the “bottom outliers” (for example, a household consuming so little food that survival could not be possible) are difficult to detect and fix. Because a minimum level of consumption cannot be defined by commodity, there was no attempt to make imputations to compensate for low spending. Instead, the focus was on fixing the “top outliers”.
To fix top outliers resulting from data coding or data entry errors in variables related to quantities consumed (for example, the code for “kg” being applied rather than “gram,” which would lead to an overestimate of the true value by a factor of 1,000), the outlying values were replaced with the maximum of the valid positive values, calculated separately for urban and rural areas.
The detection and imputation rules used (described below) are conservative, and the proportion of outlying records found in the datasets was usually low. But fixing these outliers had a significant effect on the consumption distribution in some countries.
A value was flagged as being a potential outlier if it exceeded the average amount consumed in the third quartile plus 5 times the interquartile range, where the interquartile range is the difference between the first and third quartiles of the data. For some items (for example, food, transport services, and personal effects), the outliers were detected through the use of per capita values. For others (for example, rent or durable goods), they were detected through the use of per-household values.
Once records were flagged on the basis of these criteria, an additional confirmation step was run before imputations were made. It was assumed that if the values reported by a household for three or more nonfood items were flagged as being outliers, this might indicate a rich household. It was also assumed that relatively wealthy households (defined as those belonging to the top two consumption quintiles) might spend an unusually large share of their income on education or jewelry. Flags on the corresponding records were therefore removed. Outlier values were then replaced with the weighted mean of the nonextreme values for the consumption variable in question. Urban and rural means were calculated separately, by decile of population. Doing this resulted in an imputed value that is higher for wealthier households.
Step 3: Mapping commodities to the ICP/COICOP classification
The third step was to map commodities found in each survey dataset to a standard classification of products and services, and to aggregate these standard products and services into sectors and categories. This step used the International Comparison Program (ICP) classification, equivalent to the international Classification of Individual Consumption According to Purpose (COICOP). The ICP breaks down household consumption into 110 “basic headings” (107 of which can possibly be found in household surveys). A detailed description of the sectors, categories and products and services is provided here as an XLS document.
The design of some household survey questionnaires is based on the COICOP classification, or a national adaptation of it, which makes the mapping easier. But in many cases survey questionnaires do not provide sufficient detail in describing goods and services or do not cover all basic headings. Four situations can occur:
- No data are available in the survey for a particular COICOP basic heading. The ability to measure true household consumption would require that a survey questionnaire cover all possible categories of products and services. But none of the surveys collected data on all 107 basic headings. Some exclusions in the coverage of commodities are predictable and justified, such as for pork and alcoholic beverages in Muslim countries and for rare items such as purchases of package holidays in low-income countries. But others are less justified and may be a result of poor design of the survey instrument. The extent of gaps in the coverage of commodities varies from country to country.
- One item in the survey corresponds to one COICOP basic heading. In some cases there is a perfect match between an item in the survey questionnaire and a basic heading. The mapping is straightforward.
- Multiple items correspond to one COICOP basic heading. This is most often the case for food items, such as fruits and vegetables. For example, in the dataset for Brazil (where the diary method was used to collect data on daily consumption), 274 different items are mapped to the basic heading “fresh or chilled vegetables other than potatoes.” In the dataset for Bangladesh 22 items are mapped to this basic heading. Mapping is also straightforward in these cases; it involves mapping the multiple values reported by the household to the relevant basic heading.
- One item in the survey corresponds to more than one COICOP basic heading. For example, a survey could ask respondents to report their expenditures on “gas and electricity,” while under the COICOP classification “gas” and “electricity” are two separate basic headings. Cases like these require splitting the value reported by the household between two or more basic headings. This was done by using national accounts data provided by the countries.
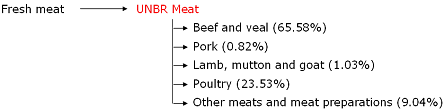
The following examples illustrate the procedure for splitting reported values between basic headings. Suppose that the national accounts data for a particular country provide the consumption shares for “fresh meat” as shown in column 1 of table 1.
Table 1. Illustrative data on reported consumption shares for fresh meat
|
Basic heading |
(1) Share of total consumption (%) |
(2) Share of consumption of fresh meat (%) |
(3) Share of consumption of selected headings (%) |
|
Total fresh meat |
8.8217 |
100.0000 |
100.0000 |
|
Beef and veal |
4.4736 |
65.5784 |
|
|
Pork |
0.0559 |
0.8197 |
|
|
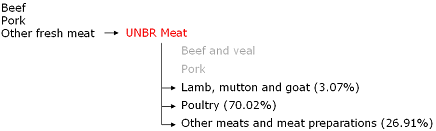
Lamb, mutton and goat |
0.0703 |
1.0306 |
3.0671 |
|
Poultry |
1.6051 |
23.5288 |
70.0221 |
|
Other meats and meat preparations |
0.6169 |
9.0426 |
26.9109 |
Case 1. The survey questionnaire asked households to report how much they spent on “fresh meat” without any other detail. The reported value must be split among five basic headings. The shares would be normalized so that their total is 100% (see column 2 in table 1), and the reported value reallocated accordingly. For example, for a household that reported spending 300 local currency units (LCU) on “fresh meat,” five separate expenditures would be created: 196.74 on beef and veal, 2.46 on pork, 3.09 on lamb, mutton, and goat, 70.59 on poultry, and 27.12 on other meats and meat preparations.
Case 2 . The survey collected consumption data with some but not all necessary details. For example, the questionnaire asked respondents to report expenditures on “beef,” “pork,” and “other fresh meat.” In this case the shares of the basic headings excluding beef and pork would be normalized (see column 3 in table 1), and the reported value for “other fresh meat” would be distributed among the three basic items not listed in the questionnaire.
This splitting method applies the same proportions to all households. The commodities that need to be split generally represent a small share of the national consumption.
A summary table indicating the number of items mapped to each COICOP product/service for each survey is provided here.
Note: Many surveys collect information on expenditure on “ceremonies” or an equivalent item. Such items cannot be split because they often cover many types of expenses (catering, transport, services, food of all kinds, and others) and no reliable information is available for distributing the expenses among the many basic headings. Data on items like these were not included in the calculation of household consumption or expenditure aggregates.
Step 4: Extrapolation to 2010
In the fourth step, extrapolations were done to convert all consumption and population data to a common reference year, 2010.
For consumption data, the 2010 values were obtained by multiplying the survey values by the ratio of the household final consumption expenditure per capita (current) in 2010 to the corresponding value in the survey year. These data account both for inflation and for real growth in household consumption. The household final consumption data were obtained from the World Bank’s World Development Indicators database: household final consumption expenditure per capita (current LCU), series code NE.CON.PRVT.CN (downloaded on October 2, 2012).
For Guinea, for example, the survey was conducted in 2007. The household final consumption expenditure per capita in current local currency units was 3,177,774 in 2010 and 1,547,012 in 2007 (the survey year). All survey values were thus multiplied by 3,177,774/1,547,012 = 2.054137.
The consumption data were then converted from local currencies into U.S. dollars and into international dollars adjusted for purchasing power parity (PPP$), again by using data from the World Development Indicators database: official exchange rate (LCU per US$, period average), series code PA.NUS.FCRF (downloaded on October 3, 2012); and PPP conversion factor, private consumption (LCU per international $), series code PA.NUS.PRVT.PP (downloaded on October 2, 2012). Please note that these conversion factors are based on the 2005 round of the International Comparison Program (ICP) and not on the 2011 ICP round whose results have been published in May 2014).
For population data, the household weighting coefficients (sample weights) in the survey datasets were adapted by multiplying them by a factor that would guarantee that the extrapolated survey population (separated into urban and rural segments) would correspond to the 2010 population data published in the World Development Indicators database: population, total, rural, and urban, series code SP.POP.TOTL, SP.RUR.TOTL, and SP.URB.TOTL (downloaded on October 1, 2012).
Step 5: Review and validation
The resulting data (particularly the mean and distribution of aggregate consumption) were compared with data from other sources, particularly the respective survey reports and the World Bank’s online poverty database, Povcalnet . The Global Consumption Database is not an exact replication of national or Povcalnet estimates, because of differences in the methods used for annualization and for fixing outliers. In addition, the Global Consumption Database includes consumption items (particularly health expenditure) that would not be used in measuring poverty. The database therefore should not be used to produce poverty estimates.
Step 6: Production of summary tables and metadata
The sixth step was to generate a standard set of tables for each country showing consumption and demographic patterns across consumption segments (established by using global thresholds defined in PPP$ terms), by population category (e.g. lowest, low, middle, higher consumption segment), and for both urban and rural areas. Other information was added, including metadata on the survey and questionnaire design. Finally, an aggregate table summarizing the information from all country tables was produced.
|
Because household surveys differ across countries in design, methodology, and timing, there are limits to the extent to which household data can be standardized after they have been collected. Comparisons of household data across countries and over time must therefore be done with caution. |
The Global Consumption Database uses multiple types of surveys, depending on data availability—including household budget surveys, living standards measurement surveys, and various kinds of country-specific socioeconomic surveys. All these surveys measure consumption or expenditure at the household (not individual) level. But because the surveys are designed for different purposes (such as to measure poverty or to update the consumption basket used to compile consumption price indices), they may differ substantially in design and methodology.
Key differences between surveys include these:
- Duration of data collection. Data may be collected over a period of 12 months to account for seasonality or over a shorter period (a few weeks or a few months).
- Method for household reporting on consumption. Some surveys collect data on food and some nonfood consumption using diaries in which households or individuals report daily on what they spend. But most rely on the “recall method,” asking households to report what they recall spending over a certain period. The recall period varies across surveys and categories. For example, data might be collected on spending on food for “the past 7 days,” “the past 2 weeks,” or “a typical month”; on education for “the past 12 months” or “the last academic year”; on rent, outpatient health services, and clothing and footwear for “the past month” or “the past 4 weeks”; and on durable goods and hospitalization for “the past 6 or 12 months.” The choice of recall period may have a substantial effect on the levels of consumption reported. Longer recall periods for frequently purchased items typically produce lower levels of reported spending than do shorter recall periods.
- Level of detail. Some survey questionnaires include a long, detailed list of goods and services; others provide a shorter, more aggregate list. Longer lists with a finer breakdown of categories typically generate higher estimates of consumption.
- Method for estimating rental value of dwellings. In some countries, surveys ask households that own their home or occupy it for free to provide an estimate of the rental value of the dwelling. In others, surveys collect data on the characteristics of dwellings that can be used to impute the rental value of owner-occupied dwellings through hedonic regressions. And in still other countries it is not possible to measure the rental value of owner-occupied dwellings because the rental market is too limited. Because this rental value represents a substantial share of household expenditure, these differences have major implications for the calculation of household consumption aggregates and for the comparability of data across countries.
- Method for estimating value of durable goods. Some surveys collect data on household expenditures on durable goods such as musical instruments. Others attempt to estimate the annual “use value” of these goods. Estimating the use value of a good requires data on its price and date of purchase or on its resale value, data that are not available in all surveys. This too affects the calculation of household consumption aggregates and the cross-country comparability of data.
Four levels of consumption are used to segment the market in each country: lowest, low, middle, and higher. They are based on global income distribution data, which rank the global population by income per capita. The lowest consumption segment corresponds to the bottom half of the global distribution, or the 50th percentile and below; the low consumption segment to the 51th–75th percentiles; the middle consumption segment to the 76th–90th percentiles; and the higher consumption segment to the 91st percentile and above.
- Lowest—below $2.97 per capita a day
- Low—between $2.97 and $8.44 per capita a day
- Middle—between $8.44 and $23.03 per capita a day
- Higher—above $23.03 per capita a day