Getting people into jobs
Goal 8 aims at full employment for all age groups and identifies work, education, and training for young people as part of that aim (targets 8.5 and 8.6). The world's population is young: 42 percent is under age 25. In South Asia and Sub-Saharan Africa the number of people ages 15–24 has been steadily rising, to 525 million in 2015—almost half the global youth population (figure 8a). Jobs for young people are important for several reasons: they are an important vehicle for the social, economic, and political inclusion of groups and individuals, and a lack of jobs can lead to discontent and unrest among disaffected young people.1 Moreover, an individual's first job tends to set a precedent for lifelong earnings, and those with poor job prospects risk falling into "low-pay traps."2
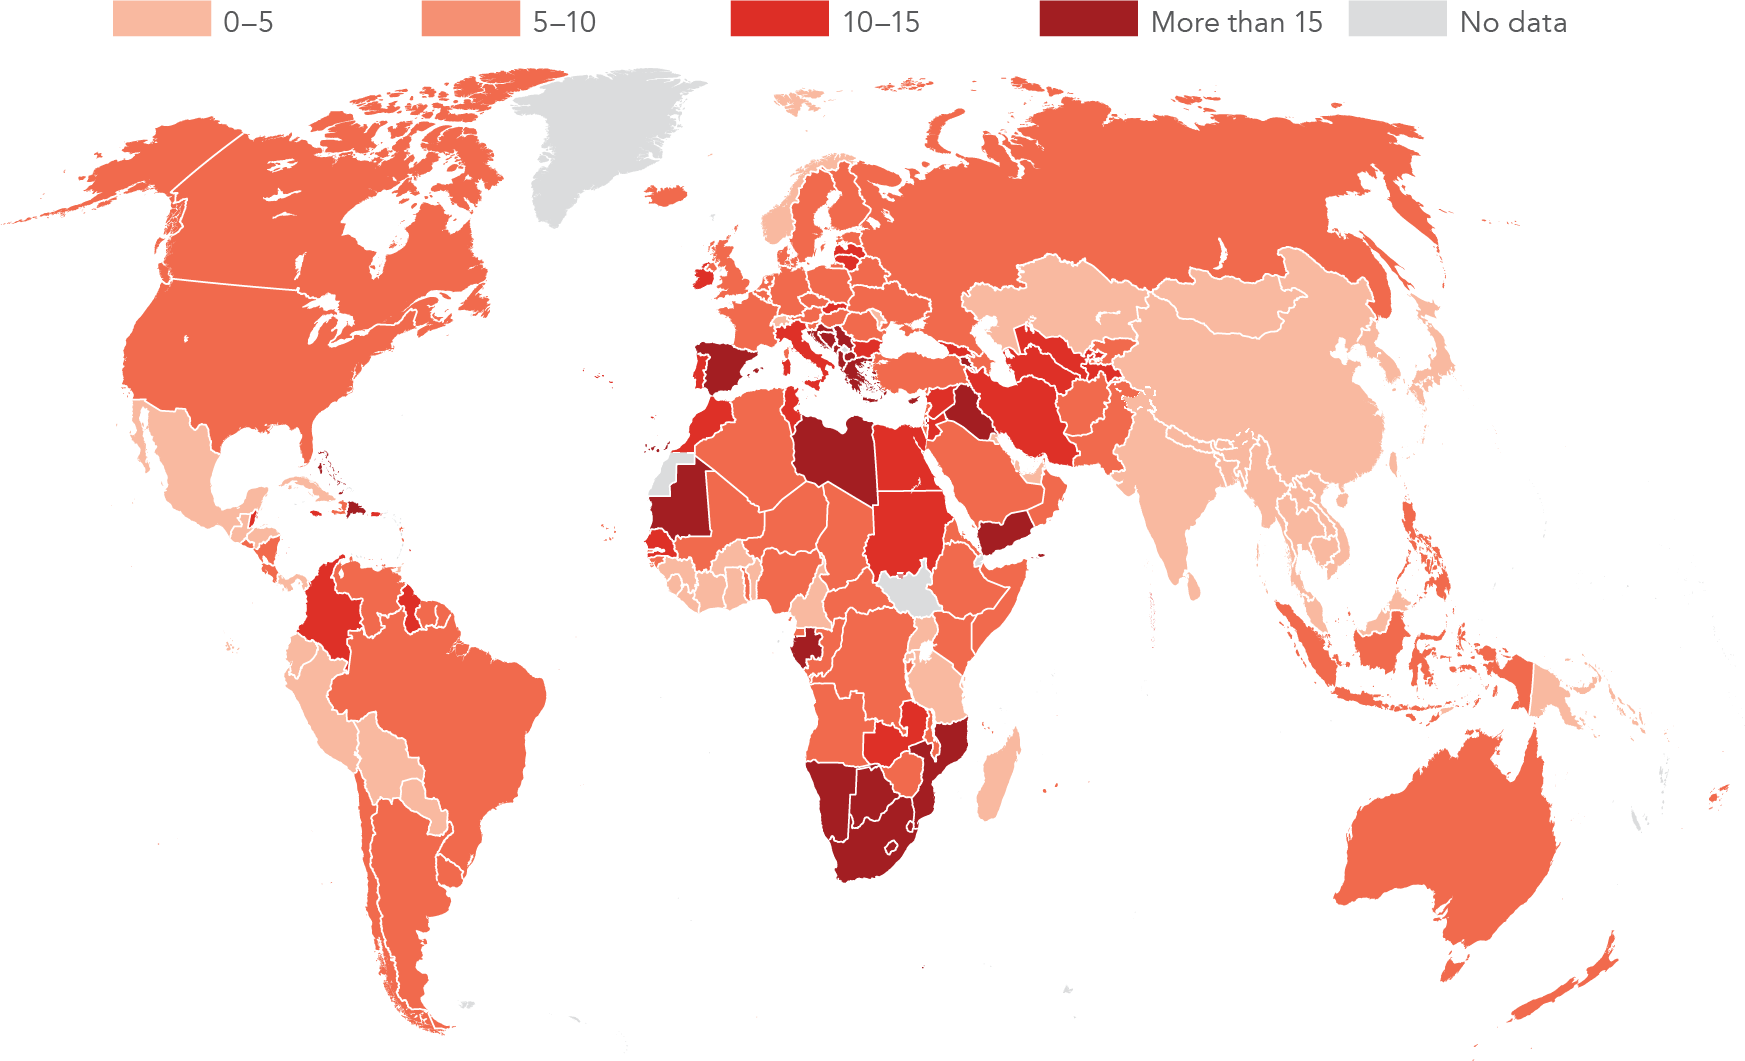
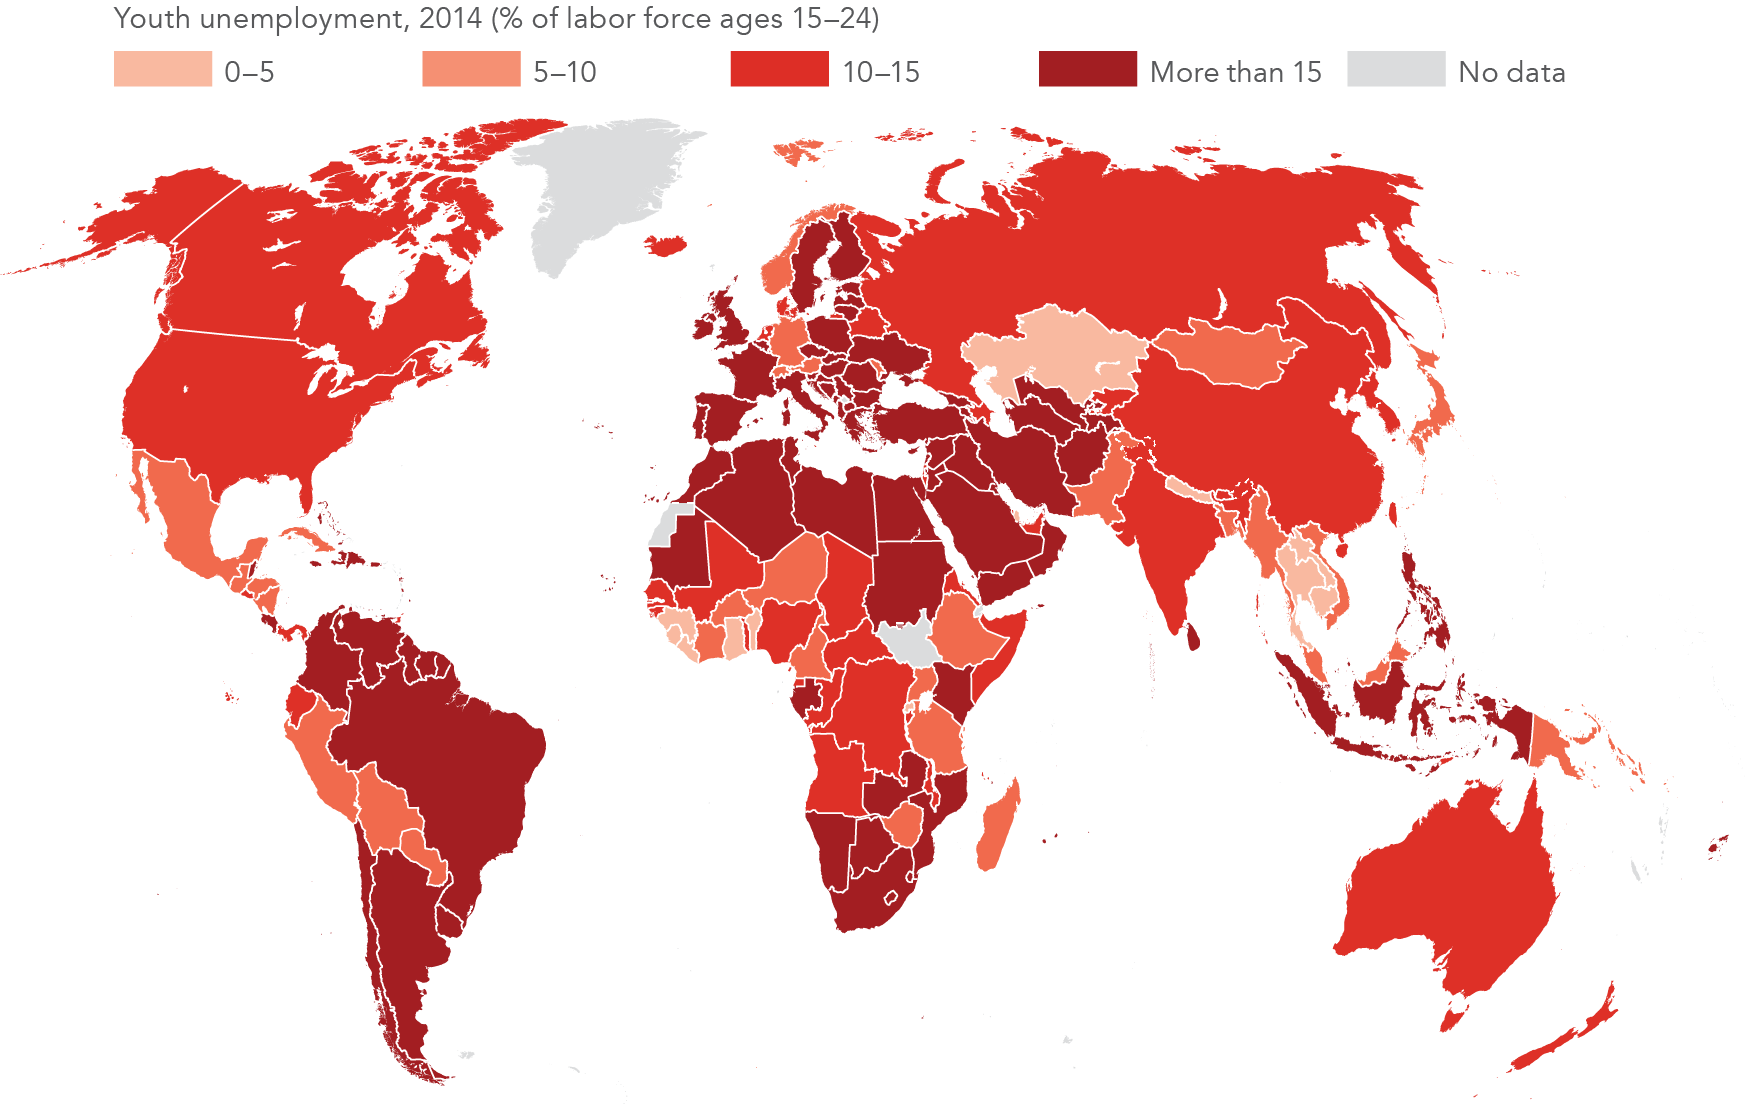
Sixty percent of young people ages 15–24 worldwide are jobless. Less than a quarter of young people in the Middle East and North Africa and a third in Europe and Central Asia—considerably less than the percentage of adults—have a job. Because young people are often involved in education and training, they are more likely than adults to be out of the labor force (figure 8b). But these gaps also reflect the fact that the youth unemployment rate is higher than the total unemployment rate in every region (figure 8e).
In many middle-income countries, a high proportion of young people are not in employment, education, or training. Neither working nor developing their productive skills for the future, this group represents a lost opportunity. Young women are much more likely than men to fall into this group, and a gender gap persists in countries at all incomes (figure 8c). The low activity of women is the result of several factors, including their primary role in households and families as well as societal norms that limit their participation in working life.
Expanding productive job opportunities for youth
Young people in low-income countries are more likely to have jobs than young people in middle- and high-income countries. Compelled to help support their families, many drop out of school prematurely and end up in precarious and low productivity employment, with few opportunities for advancement. They are often disproportionately in agricultural activities, which tend to have lower labor productivity and offer lower earnings and profits than do industry and services. And in many countries they are more likely than adults to be in unpaid work, contributing to family household enterprises (figure 8d).
Increasing growth in the Least Developed Countries
Economic growth drives development by providing more resources for better education; improved health; expanded transport, water, and energy infrastructure, and higher personal consumption. Economies grow as work and workers become more productive. Achieving persistently high growth is not easy, and few of the Least Developed Countries consistently reach 7 percent average annual GDP growth (target 8.1). In addition, many countries are growing in unsustainable ways—achieving economic growth at the expense of existing resources, shifting the burden of environmental degradation and damage to the health and well-being of a future citizenry.
Goal 8 calls for decoupling environmental degradation from growth (target 8.4). One way to measure decoupling is to compare the rates of change in environmental degradation and in economic growth (figure 8f). Degradation includes the costs of greenhouse gas emissions from fossil fuels, agriculture, forestry, and land use change; the harvest of forest timber resources beyond sustainable rates; and reduced labor output due to premature mortality caused by exposure to environmental risk factors such as air pollution, unsafe water and sanitation, and harmful substances in the workplace.3
With strong decoupling, environmental degradation declines while the economy continues to grow (green area in figure 8f). However, most countries show weak decoupling or intensified coupling. With weak decoupling, degradation may decline, but at a slower rate than economic growth (blue area in figure 8f). About 80 percent of low-income countries show weak decoupling, owing largely to reduced health risks from household air pollution and unsafe water and sanitation. With intensified coupling, degradation increases at an even faster rate than economic growth (red area in figure 8f). About 40 percent of middle-income countries and 70 percent of high-income countries show intensified coupling.
Degradation per dollar of economic output continues to be nearly 20 times higher in low-income countries than in high-income countries. And illnesses due to exposure to environmental health risks cause more than 9 million premature deaths each year. That is 16 percent of all deaths recorded for 2015, and three times more deaths than were attributed to malaria, HIV and AIDS, and tuberculosis combined.4 So any analysis of decoupling should also consider the magnitude of degradation and the ability of people and the natural environment to cope with these pressures.
Expanding access to financial services
Financial services enable individuals to manage and enhance their incomes, assets, and investments (target 8.10). Having a transaction account is more useful when there is a broad network of access points with wide geographic coverage.
By the end of 2015 there were 1,214 access points to financial services per 100,000 adults worldwide, up 19 percent from 2014 (figure 8g). Access points can be grouped into four categories: automated teller machines, point-of-sale terminals, branches of payment services providers, and agents of payment services providers.5
In 2015 the number of point-of-sale terminals increased by 9 million globally, to 1 per 100 adults. In recent years, the number of automated teller machines has also increased, but at a slower rate than the number of point-of-sale terminals. In addition to traditional services (such as withdrawals, deposits, and account inquiries), the expansion of automated teller machine functions enables customers to perform a broader range of transactions.
Agents—entities that provide some banking and retail payment services on behalf of a payment service provider—have spread across some regions and provide financial services to areas and populations that are underserved by traditional bank branches or are otherwise unprofitable. In 2015 more than half a million new payment services provider agents were established in 25 countries where 70 percent of the world's unbanked population resides.
Notes
- World Bank. 2012. World Development Report 2013: Jobs. Washington, DC.
-
P. Falco, A. Kerr, P. Paci, and B. Rijkers. 2014. "Working Toward Better Pay: Earning Dynamics in Ghana and Tanzania." World Bank, Washington, DC.
-
World Bank staff estimates using data on greenhouse gas emissions from CDIAC (Carbon Dioxide Information Analysis Center, Oak Ridge National Laboratory, U.S. Department of Energy), 2015, Fossil-Fuel CO2 Emissions (http://cdiac.ornl.gov/trends/emis/meth_reg.html) and Food and Agriculture Organization, 2016, FAOSTAT database (http://faostat3.fao.org); data on roundwood harvest and exports from FAO (2016); data on premature mortality due to environment-related health risks from IHME (Institute for Health Metrics and Evaluation), 2016, Global Burden of Disease Study 2015 (http://ghdx.healthdata.org/gbd-results-tool).
-
See Forouzanfar et al. (2016); data may be accessed at the IHME, Global Health Data Exchange, GBD Results Tool.
-
Some double counting may occur.