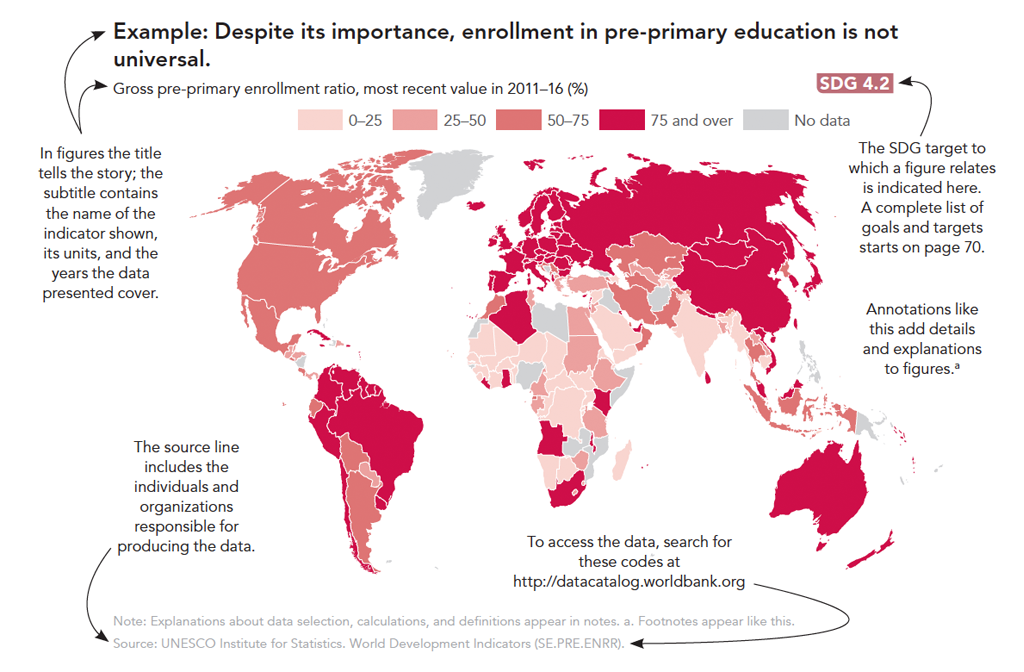
The Atlas of Sustainable Development Goals 2018 presents maps, charts, and stories related to the Sustainable Development Goals (SDGs). It discusses trends, comparisons, and measurement issues using accessible and shareable data visualizations.
The data draw on the World Development Indicators (WDI) database—the World Bank’s compilation of internationally comparable statistics about global development and the quality of people’s lives. For each of the SDGs, relevant indicators have been chosen to illustrate important ideas.
In some cases—for example, those in which country or temporal coverage is limited—supplementary data from other databases or published studies have been used. For some targets, there may be no reliable data to use for comparisons between countries or to measure progress.
The cutoff date for data included in this edition is March 30, 2018.
The 2018 Atlas uses two primary methods for classifying and aggregating countries and economies—by income (as defined for the World Bank’s 2018 fiscal year) and by region.
For more information, including details on the structure of the coding scheme; the methodology, concepts, definitions, coverage, periodicity, and development relevance of all WDI indicators; and the methods used for classifying countries for analytical purposes, please refer to http://datahelpdesk.worldbank.org
All the figures in this Atlas are produced in R with ggplot2 or with QGIS. For a digital version of this publication and the source code for the majority of charts and maps, please refer to http://data.worldbank.org/sdgatlas


