As a major user of development data, the World Bank recognizes the importance of data documentation to inform users of the methods and conventions used by primary data collectors— usually national statistical agencies, central banks, and customs services—and by international organizations, which compile the statistics that appear in the World Development Indicators database.
This section describes some of the statistical practices and procedures used in preparing World Development Indicators. It covers data consistency, reliability, comparability, reporting standards of key indicators, and the methods employed for calculating regional and income group aggregates and for calculating growth rates. It also describes the World Bank Atlas method for deriving the conversion factor used to estimate gross national income (GNI) and GNI per capita in U.S. dollars. Other statistical procedures and calculations are described in the About the data sections following each theme page. Additional documentation and metadata are available in the World Development Indicators database.
Data availability, reliability, and comparability
Many factors affect data availability, reliability, and comparability. Statistical systems in many of the poorest countries are limited; statistical methods, coverage, practices, and definitions differ widely; and cross-country and intertemporal comparisons involve complex technical and conceptual problems that cannot be resolved unequivocally. Data relevant at the national level may not be suitable for standardized inter- national use due to methodological concerns or the lack of clear documentation. Delays in reporting data and the use of old surveys as the basis for current estimates may further compromise the quality of data reported. Data coverage may not be complete because of special circumstances affecting the collection and reporting of data, such as problems stemming from conflicts.
Considerable effort has been made to standardize the data, but full comparability cannot be assured, so care must be taken in interpreting the indicators. Although drawn from sources thought to be the most authoritative, data should be understood only as indicating trends and characterizing major differences among economies rather than as offering precise quantitative measures of those differences.
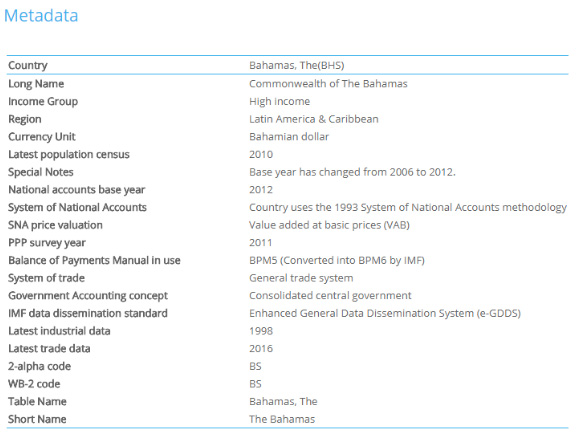
Information about each country’s statistical system, such as methodologies used for reporting economic data, or census dates, is available in DataBank.
Aggregation rules
Aggregates based on the World Bank's regional and income classifications of economies appear at the database and online tables. The 217 economies included in these classifications are shown in the map World by Income and Region. Aggregates also contain data for Taiwan, China. Regional aggregates include data for economies at all income levels, unless otherwise noted.
Because of missing data, aggregates for groups of economies should be treated as approximations of unknown totals or average values. The aggregation rules are intended to yield estimates for a consistent set of economies from one period to the next and for all indicators. Small differences between sums of sub-group aggregates and overall totals and averages may occur because of the approximations used. In addition, compilation errors and data reporting practices may cause discrepancies in theoretically identical aggregates such as world exports and world imports.
Five methods of aggregation are used in World Development Indicators:
Gap filled total. For group and world totals, missing data are imputed based on the relationship of the sum of available data to the total in the year of the previous estimate. The imputation process works forward and backward from 2010. Missing values in 2010 are imputed using one of several proxy variables for which complete data are available in that year. The imputed value is calculated so that it (or its proxy) bears the same relation- ship to the total of available data. Imputed values are usually not calculated if missing data account for more than a third of the total in the benchmark year. The variables used as proxies are GNI in U.S. dollars; total population; exports and imports of goods and services in U.S. dollars; and value added in agriculture, industry, manufacturing, and services in U.S. dollars.
Sum. Aggregates are sums of available data. Missing values are not imputed. Sums are not computed if more than a third of the observations in the series or a proxy for the series are missing in a given year.
Average (weighted and unweighted). Aggregates of ratios are denoted as weighted averages when the aggregate ratios are calculated as weighted averages of the ratios (using the value of the denominator or, in some cases, another indicator as a weight) and denoted as unweighted averages when the aggregate ratios are based on available data. Missing values are assumed to have the same average value as the available data. No aggregate is calculated if missing data account for more than a third of the value of weights in the benchmark year. In a few cases the aggregate ratio may be computed as the ratio of group totals after imputing values for missing data according to the above rules for computing totals.
Average of growth rate. Aggregate growth rates are calculated as a weighted average of growth rates. In a few cases growth rates may be computed from time series of group totals. Growth rates are not calculated if more than half the observations in a period are missing. For further discussion of methods of computing growth rates see below.
Median. Aggregates are medians of the values shown in the table. No value is shown if more than half the observations for countries with a population of more than 1 million are missing. Exceptions to the rules may occur. Depending on the judgment of World Bank analysts, the aggregates may be based on as little as 50 percent of the available data. In other cases, where missing or excluded values are judged to be small or irrelevant, aggregates are based only on the data shown.
Growth rates
Growth rates are calculated as annual averages and represented as percentages. Except where noted, growth rates of values are in real terms computed from constant price series. Three principal methods are used to calculate growth rates: least squares, exponential endpoint, and geometric endpoint. Rates of change from one period to the next are calculated as proportional changes from the earlier period.
Least squares growth rate. Least squares growth rates are used wherever there is a sufficiently long time series to permit a reliable calculation. No growth rate is calculated if more than half the observations in a period are missing. The least squares growth rate, \(r\), is estimated by fitting a linear regression trend line to the logarithmic annual values of the variable in the relevant period. The regression equation takes the form
which is the logarithmic transformation of the compound growth equation,
In this equation \(X\) is the variable, \(t\) is time, and \(a=\ln(X_0)\) and \(b=\ln(1+r)\) are parameters to be estimated. If \(b^*\) is the least squares estimate of \(b\), then the average annual growth rate, \(r\), is obtained as \(\exp(b^*)–1\) and is multiplied by 100 for expression as a percentage. The calculated growth rate is an average rate that is representative of the available observations over the entire period. It does not necessarily match the actual growth rate between any two periods.
Exponential growth rate. The growth rate between two points in time for certain demographic indicators, notably labor force and population, is calculated from the equation
where \(p_n\) and \(p_0\) are the last and first observations in the period, \(n\) is the number of years in the period, and \(ln\) is the natural logarithm operator. This growth is based on a model of continuous, exponential growth between two points in time. It does not take into account the intermediate values of the series. Nor does it correspond to the annual rate of change measured at a one-year interval, which is given by \(\frac{p_n – p_{n–1}}{p_{n–1}}\).
Geometric growth rate. The geometric growth rate is applicable to compound growth over discrete periods, such as the payment and reinvestment of interest or dividends. Although continuous growth, as modeled by the exponential growth rate, may be more realistic, most economic phenomena are measured only at intervals, in which case the compound growth model is appropriate. The average growth rate over n periods is calculated as
World Bank Atlas method
In calculating GNI and GNI per capita in U.S. dollars for certain operational and analytical purposes, the World Bank uses the Atlas conversion factor instead of simple exchange rates. The purpose of the Atlas conversion factor is to reduce the impact of exchange rate fluctuations in the cross-country comparison of national incomes.
The Atlas conversion factor for any year is the average of a country's exchange rate (or alternative conversion factor) for that year and its exchange rates for the two preceding years, adjusted for the difference between the rate of inflation in the country and the rate of international inflation.
The objective of the adjustment is to reduce any changes to the exchange rate caused by inflation.
A country's inflation rate between year \(t\) and year \(t–n(r_{t–n})\) is measured by the change in its GDP deflator (\(p_t\)):
International inflation between year \(t\) and year \(t–n\) \(\big(r_{t-n}^{SDR\$}\big)\) is measured using the change in a deflator rate based on the International Monetary Fund's unit of account, special drawing rights (or SDRs). Known as the SDR deflator, it is a weighted average of the GDP deflators (in SDR terms) of China, Japan, the United Kingdom, the United States, and the euro area, converted to U.S. dollar terms; weights are the amount of each currency in one SDR unit.
The Atlas conversion factor (local currency to the U.S. dollar) for year \(t\big(e_t^{atlas}\big)\) is given by:
where \(e_t\) is the average annual exchange rate (local currency to the U.S. dollar) for year \(t\).
GNI in U.S. dollars (Atlas method) for year \(t(Y_t^{atlas\$})\) is calculated by applying the Atlas conversion factor to a country's GNI in current prices (local currency) (\(Y_t\)) as follows:
The resulting Atlas GNI in U.S. dollars can then be divided by a country's midyear population to yield its GNI per capita (Atlas method). Using the Atlas GNI per capita, economies are currently divided into four income groupings: low, lower-middle, upper-middle, and high. For further information of the World Bank income classification visit here.
Alternative conversion factors
The World Bank systematically assesses the appropriateness of official exchange rates as conversion factors. An alternative conversion factor is used when the official exchange rate is deemed to be unreliable or unrepresentative of the rate effectively applied to domestic transactions of foreign currencies and traded products. This applies to only a small number of countries. Alternative conversion factors are used in the Atlas methodology and elsewhere in World Development Indicators as single-year conversion factors.
Useful Links
Knowledge Base
What methods are used to calculate aggregates for groups of countries?
The World Bank Atlas method - detailed methodology
How does the World Bank classify countries?
WDI related products