

Partnerships for the goals
Remittances: a lifeline for many economies
SDG 17 emphasizes the importance of partnerships for global development and focuses on facilitating and strengthening financial links between countries. Remittances are monetary transfers sent by workers living abroad to their families at home. The ability to find employment abroad and send money home is critical for many of the world’s most economically disadvantaged people (SDG target 17.3).
Before the COVID-19 pandemic, migration and remittances were trending upward. Remittance inflows to low- and middle-income countries had come to exceed official development assistance by a factor of three, reaching $548 billion in 2019 and overtaking foreign direct investment for the first time.
Remittance flows to low- and middle-income countries are expected to decline in 2020, but to remain higher than FDI or Aid
Data for 2019 represent estimates; data for 2020 and 2021 are forecasts (October 2020)
Source: KNOMAD-World Bank staff estimates, World Development Indicators, and International Monetary Fund (IMF) Balance of Payments Statistics (BPM6).
Border closures and the economic slowdown related to COVID-19 have drastically reduced the number of employment opportunities for migrant workers. As a consequence, remittance flows to low- and middle-income countries (LMICs) are projected to fall 14 percent by 2021 when compared to 2019 pre-COVID levels, the steepest drop in recent history.They are expected to eventually rebound, as the main drivers behind remittances will likely persist. People will continue to search for better economic opportunities, driven by income gaps, demographic imbalances, and climate change.
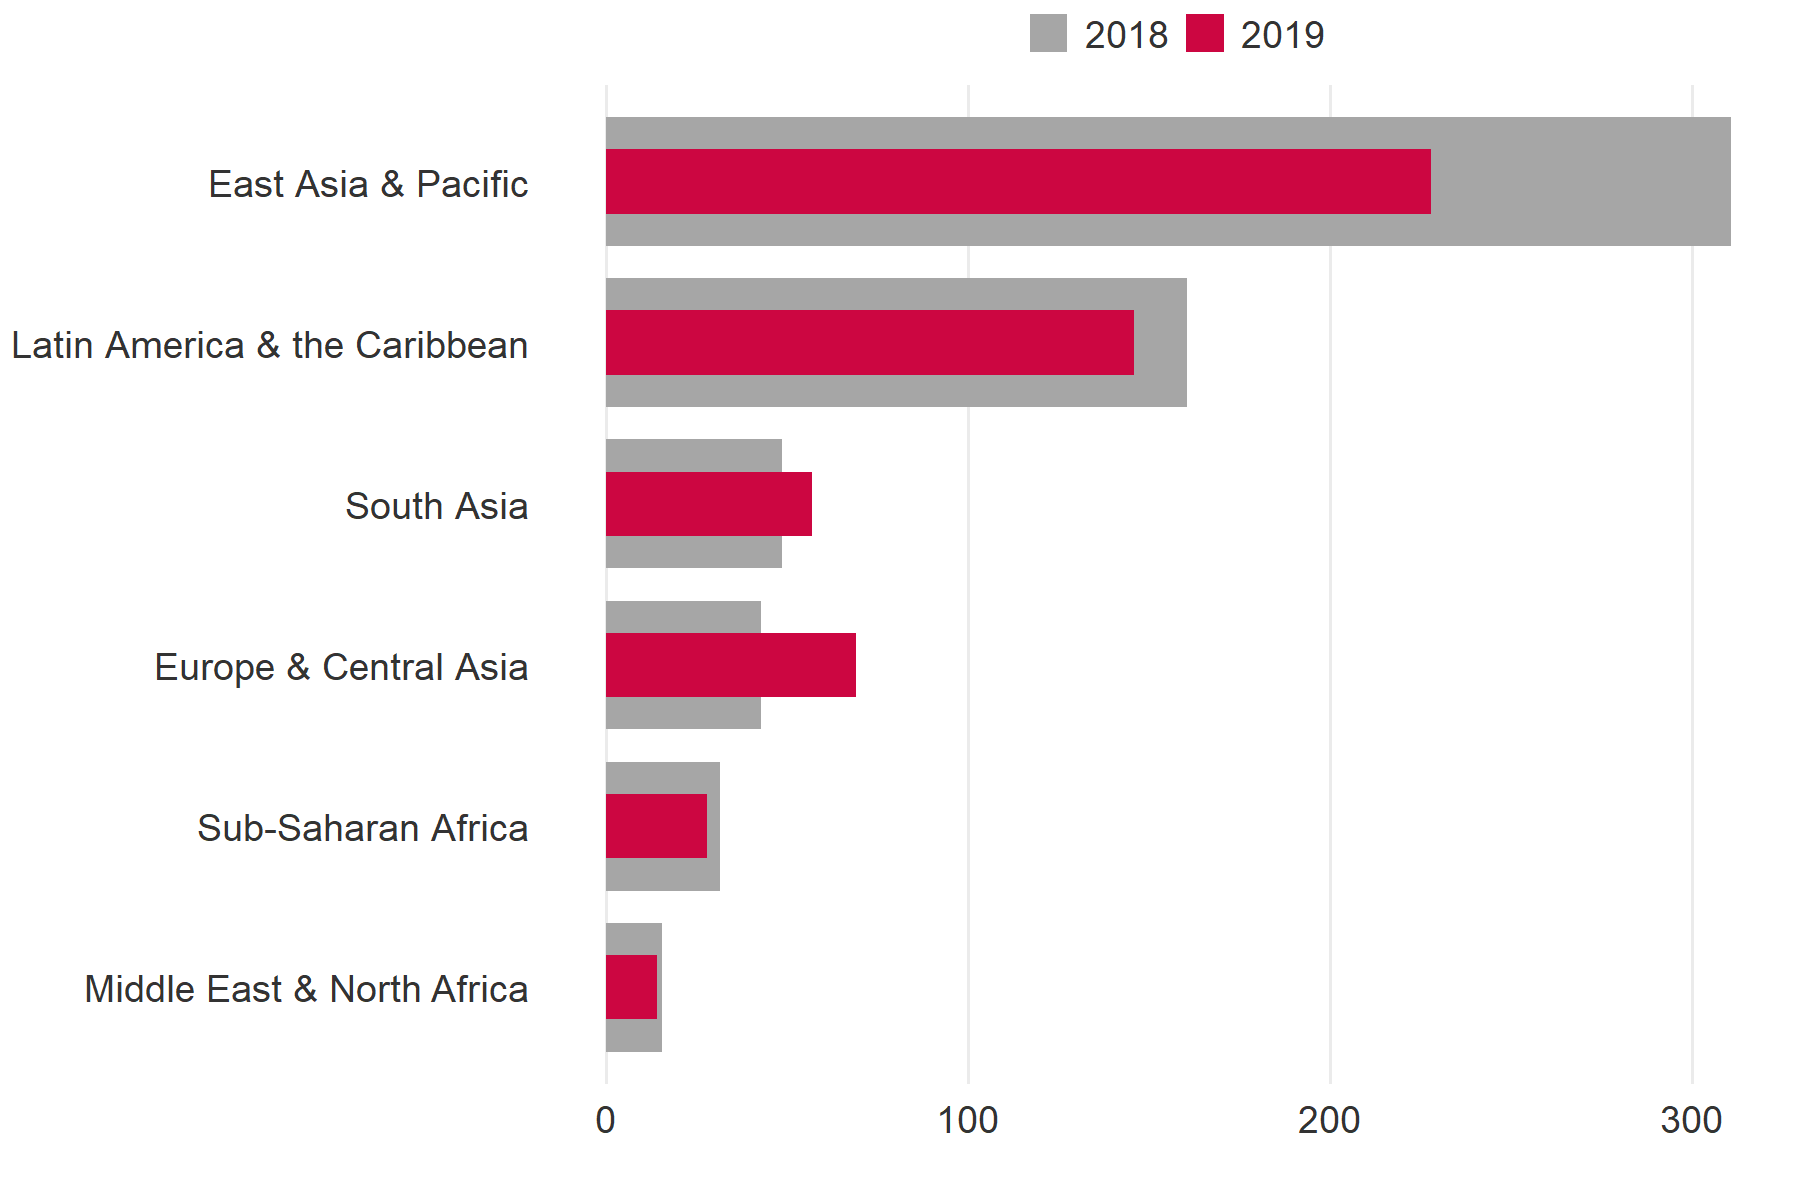
Remittances to LMICs are expected to decline by 7 percent in 2020, and by a further 7.5 percent in 2021. Regionally, remittances are projected to fall the most in Europe and Central Asia (by 16 percent and 8 percent, respectively), followed by East Asia and the Pacific (11 percent and 4 percent), the Middle East and North Africa (8 percent and 8 percent), Sub-Saharan Africa (9 percent and 6 percent), South Asia (4 percent and 11 percent), and Latin America and the Caribbean (0.2 percent and 8 percent).
The COVID-19 pandemic, falling oil prices, and currency devaluations will have a considerable impact on remittance outflows and job opportunities in the Russian Federation and Gulf Cooperation Council countries, which employ a large share of the migrant populations from Central and South Asia, respectively.
Globally, remittance flows are projected to shrink 14% by 2021
Growth of remittances by region (%) in low- and middle-income economies
Data for 2019 are estimates, data for 2020-2021 are forecasts; f = forecast
Source: KNOMAD-World Bank staff estimates (October 2020). See appendix in Migration and Development Brief 32 for forecast methods (World Bank 2020c).
Remittances go directly to recipients, are usually more stable than capital flows, and can act as insurance during economic crises and after natural calamities.
The case of Haiti is illustrative. It is the poorest economy in the Latin America and the Caribbean region and has faced numerous natural disasters. In 2019 remittance inflows to the country accounted for 37 percent of GDP, one of the largest ratios in the world. Remittances inflows to Haiti grew faster than official development assistance and aid (ODA) between 1999 and 2010, when a devastating earthquake led to a large spike in international aid. Since 2012, remittances—mostly from the United States, the Dominican Republic, France, and Canada—again exceeded both official aid and foreign direct investment.
In Haiti, personal remittances have consistently surpassed international aid, except in the immediate aftermath of the 2010 earthquake
Source: World Development Indicators (BX.TRF.PWKR.CD.DT, DT.ODA.ALLD.CD, BX.KLT.DINV.CD.WD)
Remittances usually account for a larger share of GDP in smaller, poorer economies. When looking at bilateral remittance flows between countries we can see that not all migrant workers move to high-income countries, and that middle-income countries are also an important source of remittances.
Remittance-receiving economies
Economies where remittances account for at least 1% of GDP
Note: For additional details please refer to note 4 in the reference section
Source: World Bank-KNOMAD staff estimates
Remittances accounted for almost a third of the Kyrgyz Republic economy in 2019. Approximately 80 percent were sent by migrant workers who had found employment in Russia—often seasonal jobs in construction—making the Kyrgyz Republic vulnerable to economic downturns in Russian Federation. Jobs in Central and Eastern European countries, such as Germany and Ukraine, are another major source of earnings for Kyrgyz migrant workers.
Remittances also account for about a third of Nepal’s economy. Among the main sources are Gulf countries, including Qatar and Saudi Arabia, as well Malaysia and India. Reduced global demand for oil, a commodity on which many destination economies in the Middle East are heavily dependent on, can severely affect the fortunes of migrant workers and their ability to send money home.
Economic migration is South–North, to middle- and high-income economies, as well as South–South, to neighboring countries. Sources of remittances can vary, even among countries in the same region. In 2019, more than 70 percent of remittances to Comoros, a lower-middle income economy in Sub-Saharan Africa, were from France, a high-income economy in Europe.
But in Lesotho, another lower-middle-income economy in Sub-Saharan Africa, landlocked and surrounded by South Africa, the migrant workforce relies almost exclusively on its only neighbor for job opportunities.
Though often spent on essential consumption, remittances are also invested in physical capital and used for health, education, and information and communication technology expenditures that improve welfare and productivity. Remittances can thus provide insurance against adverse economic shocks, such as droughts and famines, and support disaster recovery and reconstruction.
According to a recent study, money sent home by migrant workers boosted education spending by an average of 35 percent in 18 countries in Sub-Saharan Africa and Southeast Asia and by over 50 percent in Latin America. Reducing the transaction costs associated with sending remittances to 3 percent (SDG target 10.c—see below) from a global average of about 7 percent could provide an additional estimated $1 billion a year for education.
On average, international remittances increase education spending in low and middle income countries
Percentage change in education expenditure arising from remittances (the range of the 95% confidence interval)
Note: The chart shows the weighted averages of the estimated impacts on the level of education spending of whether or not households received remittance. The ‘All other’ category combines economies in Sub-Saharan Africa and Central, Southern and South-Eastern Asia. The results are based on meta-regression analysis of the estimates for 30 countries (73 studies).
Source: Askarov and Doucouliagos (2018)
When transferring money is expensive, the benefits of remittances are reduced. The price of sending money home can be very high relative to the amount sent and to workers’ incomes.
SDG target 10.c calls for reducing the transaction costs of remittances to less than 3 percent by 2030. The average cost to send money to low- and middle-income countries declined from 9.7 percent in 2009 to just below 7 percent in the beginning of 2020, still more than twice the target. The cost to send money to Africa is even higher: about 9 percent. South–South remittance costs are high due to foreign exchange controls and additional costs associated with currency conversions.
The cost of sending remittances remains high
Average cost of sending $200
Source: Remittance Prices Worldwide database, World Bank
Banks making wire transfers charge the highest fees for sending money, while post offices and money transfer operators paying through mobile wallets or bank accounts charge the least. Many countries mandate exclusive partnerships between money transfer operators and post offices, which can drive up prices. And anti-money-laundering regulations make it difficult for migrant workers to send small sums.
Banks are the costliest channel for sending remittances
Cost of sending remittances by type of provider
Source: Calculations by World Bank staff for 2018 Q4 based on the Remittance Prices Worldwide database, World Bank
Remittances are also sent and received through informal channels, making it more difficult to calculate the true size of the flows. Both remittance sending and remittance receiving countries can focus on improving the remittance infrastructure to reduce the high cost of remittance fees on migrants. Supporting the expansion of digital money transfers and facilitating the access to banking services for both customers and service providers of digital remittances can help bring costs down.
Learn more about SDG 17: Partnerships for the goals
Swipe for the next chart
Notes
- Dilip Ratha, Supriyo De, Eung Ju Kim, Sonia Plaza, Ganesh Seshan, and Nadege Desiree Yameogo. 2020. “Migration and Development Brief 33: Phase II: COVID-19 Crisis through a Migration Lens.” KNOMAD-World Bank, Washington, DC. License: Creative Commons Attribution CC BY 3.0 IGO ↩
- Ibid ↩
- World Bank. 2019. Leveraging Economic Migration for Development: A Briefing for the World Bank Board. Washington, DC: World Bank. ↩
- These estimates are based on the methodology developed by Ratha and Shaw, 2007, "South-South Migration and Remittances," World Bank. The remittance data is for 2019, disaggregated using host country and origin country incomes, and estimated migrant stocks from 2019. Certain data points (for example Democratic Republic of the Congo, Djibouti, Nigeria, South Sudan, Togo, and Zimbabwe as remittance-receiving countries) indicate corridors with insufficient data that appear to overstate per-person remittance volume. This could be due to (a) over-recording of flows through official channels or (b) inaccurate or under-report migration stock data. Flows between India and Pakistan, Pakistan and India, Lebanon and Israel and vice versa are assumed to be zero given the political economy situations in these corridors. ↩
- Beaton, Kimberly, Svetlana Cerovic, Misael Galdamez, Metodij Hadzi-Vaskov, Franz Loyola, Zsoka Koczan, Bogdan Lissovolik, Jan Kees Martijn, Yulia Ustyugova, and Joyce Wong. 2017. “Migration and Remittances in Latin America and the Caribbean: Engines of Growth and Macroeconomic Stabilizers?” IMF Working Paper 17/144. International Monetary Fund, Washington, DC. ↩
- World Bank. 2011. Leveraging Migration for Africa: Remittances, Skills, and Investments. Washington, DC: World Bank. ↩
- Askarov, Z., and H. Doucouliagos. 2018. “A Meta-Analysis of the Effects of Remittances on Household Education Expenditure.” United Nations Educational, Scientific and Cultural Organization, Global Education Monitoring Report 2019: Migration, Displacement and Education—Building Bridges, not Walls. Paris: United Nations Educational, Scientific and Cultural Organization. ↩