National statistical systems are essential to the successful governance of nations. They provide a critical public service, and help governments make well-informed decisions about the economy, society and the environment, and enable citizens to hold governments to account. The ongoing COVID-19 pandemic further reinforced that accurate and timely data are indispensable in designing effective responses to a health and economic crisis.
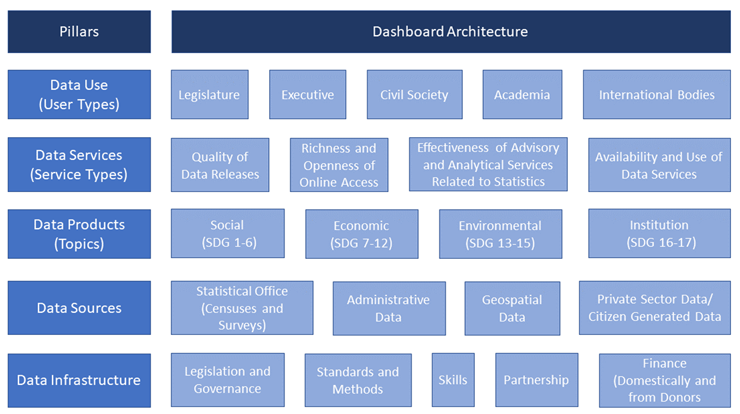
More generally, the way data are produced and consumed has been fast evolving over the past decade. Against this backdrop, it is important to understand how well national statistical systems can meet requirements, old and new, and to improve their capacities to do so. To respond to these challenges, the World Bank has replaced its highly used Statistical Capacity Indicators and Index (SCI) with the new Statistical Performance Indicators (SPI). The SPI framework focuses on 5 key new areas, also called pillars in measuring a country’s statistical performance: (i) data use, (ii) data services, (iii) data products, (iv) data sources, and (v) data infrastructure.
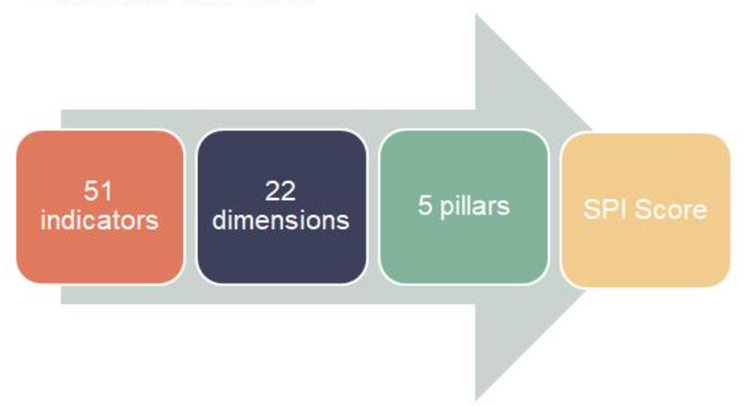
Each pillar consists of four or five dimensions; in all, there are 22 dimensions by which to evaluate a country’s statistical performance. This offers a 'dashboard’-type architecture that unpacks a country’s overall statistical performance and helps identify areas for improvement.
To measure these pillars and dimensions, a set of 51 statistical performance indicators have been developed. TheStatistical Performance overall score (or index, ranging between 0 and 100) is produced by combining these indicators.
In 2019, the SPI is available for 174 economies, covering almost all (over 99 percent) the world population. The overall SPI score ranges between 20 (Somalia) and 90 (Norway), with a median score of 59. In the map below, country SPI scores are shown by quintiles - the deep green representing the top 20% and deep orange representing the bottom 20%. High-income and OECD countries mostly perform well, and Sub-Saharan African countries score relatively poorly.
These patterns are supported when the SPI is broken down by region. North America is the region with the highest average SPI, followed by Europe and Central Asia, while the Middle East and North Africa and Sub-Saharan Africa lag behind.
Within regions, the overall SPI scores vary significantly across economies: each region has both strongand weak performers. For instance, the overall scores range from 21 to 88in the East Asia and Pacific, and between 20 and 76 in Sub-Saharan Africa.
Further disaggregation of the overall SPI scores by income level shows that low- and middle-income countries need to make significant progress. Although high-income countries generally perform well (scoring 80 out of 100 on average), they too have room for improvement.
Fragile and conflict-affected (FCS) economies, however, face more challenges. Out of 34 economies the Bank classifies as FCS, 21 are in the bottom 20% of the SPI scores, while 31 out of 34 are in the bottom 40%. States with high-intensity conflicts, such as Libya or the Syrian Arab Republic, tend to score in the bottom 20%. Small states, such as Kiribati and the Marshall Islands, score low as well.
How does the SPI relate to other commonly used development indicators? The SPI overall score correlates positively with three widely used measures of development – GDP per capita, the Human Capital Index, and the WGI Government Effectiveness Score.
While higher-income countries generally have better performing statistical systems as measured by the SPI, income is not destiny. For example, Mexico has a GDP per capita of just over $10,000, but it performs as well as countries with twice its income. Other factors – including human capital, governance, and other factors – also matter for good performance.
The examples so far focused on the SPI overall score, but users can explore similar comparisons for each of the five data pillars. The figure below shows country scores for the data use pillar along income groups.
Moreover, the SPI framework can accommodate future improvements as the global data landscape evolves.
To learn more, explore the SPI Website whichallows users to explore the data and understand the methodology underlying the SPI. https://www.worldbank.org/spi
The raw data and the code used to produce the SPI are available in this Github repository. Users are encouraged to share or adapt any of the materials available with appropriate citation of the SPI team.https://github.com/worldbank/SPI/