The world has experienced substantial but uneven progress in poverty reduction over the past three decades. In 1990, at least half of the people in East Asia, South Asia, and Sub-Saharan Africa were living in extreme poverty.1 However, the pace of poverty reduction since then has been quite different across regions. In 2019 the estimated rates of extreme poverty in these three regions were 1 percent (East Asia), 9 percent (South Asia), and 35 percent (Sub-Saharan Africa).2 It implies a stark change in the distribution of global poverty over time, which is to be considered when allocating resources among regions to end global poverty.
The world has seen significant transformations in its demographic and economic structures in recent times. In 2022, the world’s population surpassed 8 billion for the first time and, this year, India (a lower-middle-income country) has overtaken China (an upper-middle-income country) as the world’s most populous country. About 57 percent of the world population was living in low-income countries in 1990, whereas only 9 percent of the world population is now living in low-income countries. In fact, population growth and income status are highly correlated, and their interaction may result in differences in the definitions of poverty across countries and over time.
As countries evolve from low to high levels of development, the concept of poverty tends to shift gradually from absolute poverty to relative poverty. Absolute poverty captures deprivations in basic needs, such as food, clothing, and shelter, and absolute measures of poverty are fixed in real terms across time and space. Relative poverty accounts for the lack of resources to participate adequately in one’s society as it progresses. Measures of relative poverty are defined in relation to a typical measure of economic well-being (e.g., having a disposable income less than 60% of the median in the OECD). Beyond the satisfaction of basic needs, an individual would still feel poor if they are unable to afford a decent lifestyle expected of them in the society in which they live. Relative poverty, therefore, also captures inequality. More recently, societal poverty has been conceptualized as a middle ground for defining poverty, capturing both absolute and relative notions of poverty (see Ravallion and Chen (2011), World Bank (2018) and Jolliffe and Prydz (2021) for more details). These three ways of measuring poverty are discussed below.
The World Bank has official poverty lines that reflect these different concepts of poverty. These include $2.15, $3.65, $6.85, and max($2.15, $1.15 + 50% of median consumption or income), all expressed in 2017 PPP (more details on these lines below). The first three lines are the absolute poverty lines typical of low-, lower-middle-, and upper-middle-income countries, respectively.3 As the income status of a country increases, so does its national poverty line, reflecting the relative concept of poverty. The societal poverty line incorporates both absolute and relative concepts of poverty. See Jolliffe ⓡ al. (2022) for the technical analysis underpinning all these poverty lines of the World Bank.
The question of where the world’s poor live is a tricky one, because it depends on the poverty line being used to measure poverty across countries and not all countries are at the same level of development in any given year. Figure 1 shows that the regional distribution of poverty can be quite different, depending on the definition of poverty assumed.
Figure 1: The share of global poor by region
The international poverty line: a measure of absolute poverty
The international poverty line, currently set at $2.15, is the standard metric for monitoring extreme poverty in the world. This standard is based on the poverty lines used in the poorest countries of the world, which are often set to reflect the budget necessary to afford enough food to meet basic daily caloric needs. If an individual lives on less than $2.15 a day, they are counted as living in extreme poverty. Based on this line, the distribution of global poverty has changed significantly between 1990 and 2019 (see Figure 2 for more details). In 1990, fifty-three percent of the world’s population living in extreme poverty were in East Asia alone and 14 percent in Sub-Saharan Africa, behind East Asia and South Asia. In 2019, only about 4 percent of the world’s population in extreme poverty lived in East Asia. The burden of extreme poverty has shifted from East Asia to Sub-Saharan Africa, where about 60 percent of the extreme poor were living in 2019. Progress in poverty reduction in East Asia was so impressive that by 2003, South Asia became the region with the largest share of the world’s extreme poor. By 2007, Sub-Saharan Africa became second after South Asia. Sub-Saharan Africa has since 2011 been the region with the largest and growing share of the world’s extreme poor.4
Figure 2: Share of global poor living below the international poverty line, %
The population of Sub-Saharan Africa has more than doubled between 1990 and 2019.5 Rapid population growth explains about a third of the global burden of extreme poverty in Sub-Saharan Africa. Suppose regional population shares remained in 2019 as they were in 1990, and poverty rates for 1990 and 2019 remained unchanged, 40 percent and not about 60 percent of the world’s population living in extreme poverty would be in Sub-Saharan Africa. Extreme poverty would still be mostly concentrated in Sub-Saharan Africa, followed by South Asia. In fact, the relative ranking of the world’s regions by poverty status would remain unchanged.
Income-group-specific poverty line: a measure of relative poverty
National poverty lines tend to increase with economic growth and richer countries tend to have higher poverty lines, even after taking into account differences in relative prices. This pattern is consistent with the principle of non-satiation. As income increases, the commodities people need for a meaningful life often increase. A one-week vacation would be a luxury in a low-income setting, but is one of the indicators in the European Union’s material deprivation index and is therefore considered a necessity in this group of high-income countries. To account for this variation in needs across space and time, an income-group-specific poverty line could be defined that varies across countries over time, as they change income status. For each year, a country will be assigned the poverty line corresponding to its income status.6 China was a low-income country in 1998, graduated into a lower-middle-income status in 1999 and further graduated to an upper-middle-income country in 2010. Using an income-group-specific poverty line for poverty assessment would mean that poverty in China will be measured using $2.15 in 1998, $3.65 in 1999, and $6.85 in 2010. Having always been a low-income country, Burundi will be assigned the international poverty line of $2.15 for all years. See Figure 3.
Figure 3. The international poverty line and income-group-specific poverty line
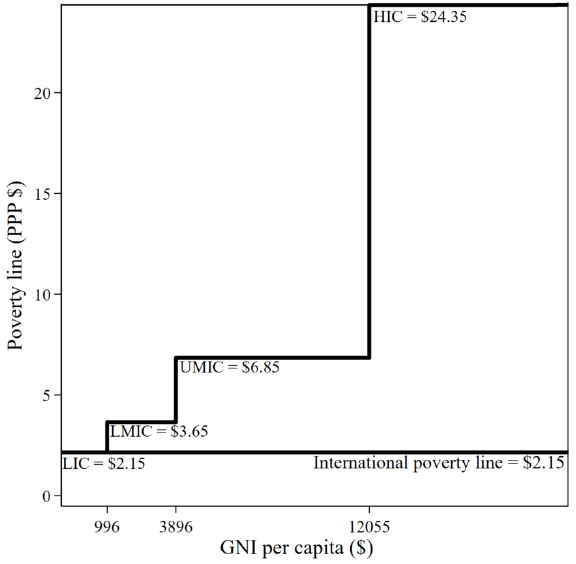
Notes: This figure illustrates the income-group-specific poverty line using data for 2017. Low-income countries (LIC) are countries whose gross national income per capita is below $996 and are assigned a poverty line of $2.15. Lower-middle-income countries are countries whose gross national income per capita falls between $996 and $3,896 and are assigned a poverty line of $3.65. Upper-middle-income countries are countries whose gross national income per capita falls between $3,896 and $12,055 and are assigned a poverty line of $6.85. High-income countries (HIC) are countries whose gross national income per capita is above $12,055 and are assigned a poverty line of $24.35.
The distribution of global poverty has evolved quite differently across regions when the poverty line varies with the income status of countries (see Figure 4 for more details). In the 1990s, when most of the world’s countries were low-income countries, the distribution of global poverty was skewed toward East Asia, South Asia, and Sub-Saharan Africa. As more countries in South Asia and Sub-Saharan Africa began joining the club of middle-income countries in the 2000s, global poverty shifted more to these regions. By 2007 when India became a lower-middle-income country, South Asia alone contributed to 36 percent of global poverty. When China became an upper-middle-income in 2010, East Asia contributed to 34 percent of global poverty.7 In sum, from 2010 to 2019, most of the global poor were living in South Asia and East Asia when using the income-group-specific poverty line. East Asia and South Asia have seen a lot of progress in reducing extreme poverty, yet a significant share of their people still have a relatively low standard of living. By 2019, 56 percent of the global poor were living in these two regions based on a relative notion of poverty.
Figure 4. Share of global poor living below the income-group-specific poverty line, %
Societal poverty line: a measure of weakly relative poverty
In more recent years, when more countries have become middle-income countries, and most of the world’s population are living in middle-income countries, the societal poverty line comes in handy. It presents a middle ground for defining poverty, capturing both absolute and relative notions of poverty. The societal poverty line is given as: max($2.15, $1.15 + 50% of median consumption or income) in 2017 PPP. That means a person is living in societal poverty if they are living on less than 1.15 dollars a day plus 50 percent of daily median consumption (or income) in their country of residence. It is a measure of inequality, as changes in its relative portion are driven by changes in inequality. It varies directly with median income (or consumption) and is country-year-specific. However, at very low-income levels (i.e., when [$1.15 + 50% of the median] is less than $2.15), the societal poverty line becomes the international poverty line ($2.15). The idea here is that, in such low-income settings, absolute (extreme) poverty is the relevant concept of poverty; it is too early to be incorporating the concept of relative poverty. For example, the societal poverty line for Ghana would be the international poverty line ($2.15) until 2000 and [$1.15 + 50% of median consumption] afterward when the country has become richer. For Burundi, the societal poverty line is the international poverty line ($2.15) for all years because of its very low levels of consumption. By contrast, the societal poverty line would be [$1.15 + 50% of median income] for all years in advanced economies, such as the United States. See Figure 5.
Figure 5. Societal poverty line
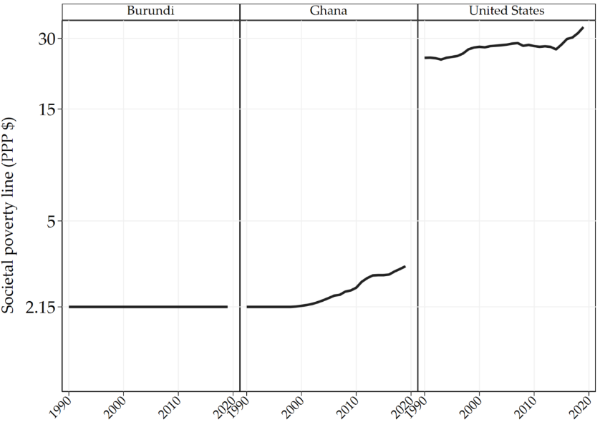
Notes: This figure illustrates the societal poverty line using data for Burundi (a low-income country), Ghana (a middle-income country) and the United States (a high-income country). The y-axis is on a log scale.
Using the societal poverty line to measure poverty across countries also yields a different regional distribution of global poverty over time (see Figure 6 for more details). Starting off with East Asia as the leading contributor to global poverty (44 percent) in 1990, the concentration of global poverty moved steadily to South Asia in the 2000s, as economic growth occurred with rising inequality, particularly in India. By 2011, when inequality began to fall in China, global societal poverty moved away from East Asia to South Asia. By 2019, 27 percent of the global poor lived in South Asia and 24 percent of the global poor lived in Sub-Saharan Africa. Most countries in these two regions have been experiencing high or rising inequality. With the societal poverty line, global poverty shifts more evenly toward other regions, such as the Rest of the World (i.e., the rich world), Europe and Central Asia and Latin America and the Caribbean (Figure 6 & Figure 1).
Figure 6. Share of global poor living below the societal poverty line, %
Summing up
When one defines poverty in a more dynamic way, such that the meaning of poverty changes over time and space, a more holistic approach is required to know where the poor live. Countries are at different levels of development in any given year, and countries’ positions in the global income distribution change over time. The changes in the regional distribution of global poverty between 1990 and 2019 have been largely driven by three regions—East Asia, South Asia, and Sub-Saharan Africa—constituting about two-thirds of the world’s population. These are also the regions that have seen drastic demographic and economic changes in the past three decades.
Regardless of the notion of poverty assumed, global poverty was mostly concentrated in East Asia in 1990. Extreme poverty has now moved to Sub-Saharan Africa and most of the world’s population living in relative poverty are in South Asia, East Asia and Sub-Saharan Africa, where a growing share of middle-income countries are located.
The authors gratefully acknowledge financial support from the UK Government through the Data and Evidence for Tackling Extreme Poverty (DEEP) Research Program.
2The poverty trends observed in the various regions of the world can be found here. In this piece of writing, poverty estimates are provided until 2019. The disruption of survey data collection during the COVID-19 pandemic makes it hard to report a complete set of regional and global poverty estimates for more recent years (see this blog for more details).
3The poverty line typical of high-income countries is $24.35 in 2017 PPP. See Jolliffe ⓡ al. (2022) for more details. This line is not one of the official poverty line of the World Bank and is therefore not as scrutinized as the other lines.
4This story focuses on monetary poverty. However, poverty is both monetary and non-monetary in a broad sense. Other measures of poverty which include non-monetary dimensions of poverty, such as the multi-dimensional poverty measure (MPM), suggest that Sub-Saharan Africa is home to even a larger share of the global poor.
5Population growth between 1990 and 2019 varies by region: Europe and Central Asia (7%), East Asia and the Pacific (32%), Latin America and the Caribbean (47%), South Asia (63%), Middle East and North Africa (78%), Sub-Saharan Africa (117%), Rest of the World – or the rich world (23%) and World (46%).
6When the World Bank reports global and regional poverty estimates using its official absolute poverty lines, it does not use the lines this way. By convention, each line is used for all countries and for all years (see an example here).
7All countries in East Asia with data had escaped low-income status by 2014. North Korea, also in East Asia, is still a low-income country but has no survey data for the measurement of poverty. When aggregating poverty across regions, countries with no survey data are assigned the regional average. For more details, see the Poverty and Inequality Platform (PIP) Methodology Handbook.