What is the World Development Indicators?
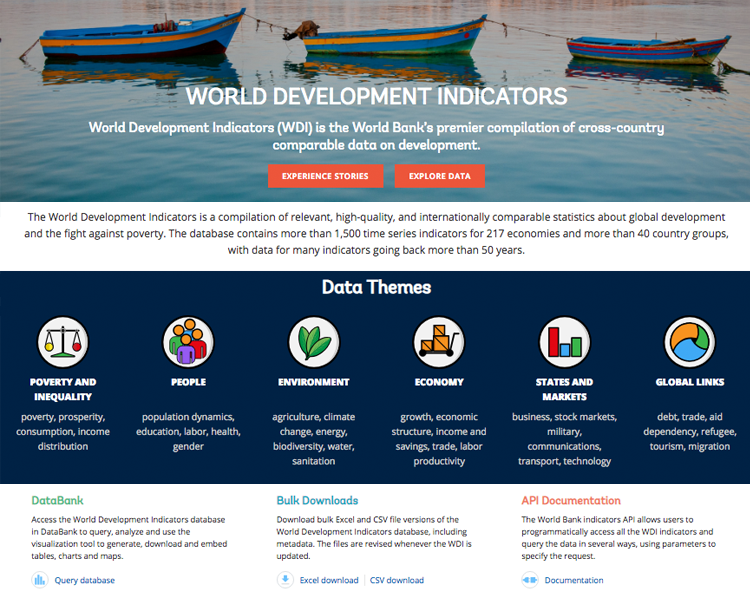
The World Development Indicators (WDI) is a compilation of relevant, high-quality, and internationally comparable statistics about global development and the fight against poverty. The online database includes 1,600 indicators for almost 220 economies, with some data series extending back more than 50 years.
The WDI helps all users - analysts, policymakers, students, academics, program managers, and all those curious about the state of the world - to find data related to all aspects of development, both historical and current, and to follow trends and monitor progress towards a myriad of goals and targets.
The number of indicators in the WDI database has grown progressively over the last almost 30 years, from 118 series in April 1989 to 1600 indicators in October of 2018. Back in the day, users had to access WDI data stored on magnetic tapes, diskettes, or CDs, and in many cases only as part of a paid subscription. In the past decade, all the data has become freely accessible through the Open Data Initiative, which made the data available on the web and via APIs and other formats.
Wasn't there a book as well?
The WDI printed publication was originally a compilation of tables produced as an annex to the 1978 World Development Report. It evolved into a standalone publication full of data tables, data stories, and methodological notes (it also benefited from a revolving color palette on the cover). As the database grew in scope, so did the book.

But as the online presence expanded, the publication became easier to pack in a briefcase…
And gradually evolved into a digital-only product…
Where does data in the WDI come from?
A share of the indicators in WDI come from World Bank Group surveys and data collection efforts, but the majority are based on data originally collected, compiled and published by other sources, including other international organizations such as UN specialized agencies (sometimes in cooperation with the World Bank), national statistical offices, organizations with a specific research or monitoring focus, the private sector, and academic studies.
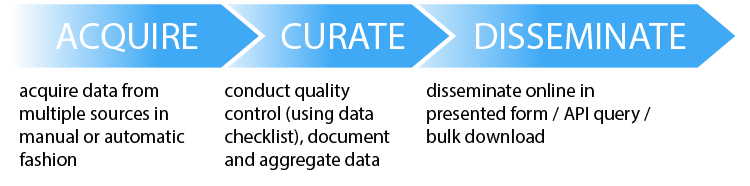
Such data from external sources is also subject to vetting and curation processes, including a range of checks and quality control efforts from the WDI team. This process usually includes calculation of standardized aggregates for regions and other groupings, but may also include verification of data that appears unreliable or incorrect, often in dialog with the data provider.
The data can be grouped into three general categories, along a spectrum from higher to lower involvement from the World Bank and the WDI team.
The indicator series can be grouped into three general categories, along a spectrum from higher to lower World Bank involvement.
Indicators based on World Bank Group surveys
The World Bank calculates many indicators directly from data gathered through specific surveys carried out locally in-country. For example indicators that measure the ease of doing business, such as the number of days required to obtain a permanent electricity connection for a warehouse, or the bribery incidence, are produced as part of the Doing Business or the Enterprise Survey projects, and are based on information collected through surveys and interviews with firms and local experts.
Indicators produced or compiled by the World Bank, but based on external data sources
Most commonly, this category applies where the World Bank applies statistical methods to calculate harmonized indicators from data gathered by the national statistical offices of individual countries. Prominent examples of this approach include:
- Estimates of extreme poverty based on the international poverty line ($1.90 a day, 2010 PPP), as calculated by the World Bank, uses primary household survey data obtained from government statistical agencies and World Bank country departments. Data for high-income economies come from the Luxembourg Income Study database.
- Data on private participation in infrastructure, which gathers publicly available information on projects from news outlets, specialized industry publications, government and company websites, and other databases.
- Global and regional estimates of child malnutrition, updated regularly through a joint project by a UNICEF, WHO and World Bank inter-agency team. These estimates are derived from nationally representative household surveys which are collected every 3 to 5 years in most countries.
- The population data in the WDI, sourced from the United Nations Population Division, Eurostat, and national statistical offices, and representing mid-year population. Updated population series are published in April and July. If the data source does not publish the mid-year estimates at the time of the WDI update, the most recent values are extrapolated using the growth rate of the previous 6 or 12 months. The historical time series reflect the data from the original source, whenever available.
- The national accounts data, including GDP, collected in local currency by World Bank country economists using the information published by the national statistical authorities, or sourced from OECD or directly from country official data. Because of time lags, GDP and GNI values are sometimes gap-filled by the World Bank in July of each year, to provide users and Bank projects with current data for analytical and operational purposes. The estimated values, which are calculated using existing official data, are generally replaced with the official values published by countries, when these become available.
Indicators sourced from other organizations
Certain indicators are produced and compiled from external sources with minimal World Bank involvement. These include series from international organizations such as balance of payments data from the International Monetary Fund or education data from UNESCO. Databases maintained by the private sector are also often in this category, such as the S&P Global Equity Indices which come from Standard & Poor's.
In general, we do not perform additional calculations in publishing these series (apart from aggregation for various geographic and economic groupings). However, the Data Group at the World Bank still collaborates and coordinates with these organizations to expand data access and enhance data quality, through advanced quality checks (for example, looking for discontinuities and outliers) and new data gathering mechanisms.
Across all these categories, the Data Group remains highly reliant on external data partners, a list of whom can be found here. World Development Indicators is a truly collaborative effort.
Who's the winner?
While GDP and population indicators are the focus of much attention, other topics are also of great interest for data seekers, including inflation, military expenditure, CO2 emissions, or health expenditure.
You can learn about these and many other indicators via the Open Data site and DataBank.