
Overview
The indicators within the Economy section allow us to analyze various aspects of both national and global economic activity. As countries produce goods and services, and consume these domestically or trade internationally, economic indicators measure levels and changes in the size and structure of different economies, and identify growth and contractions.
Economic indicators include measures of macroeconomic performance (gross domestic product [GDP], consumption, investment, and international trade) and stability (central government budgets, prices, the money supply, and the balance of payments). It also includes broader measures of income and savings adjusted for pollution, depreciation, and depletion of resources. Many economic indicators from WDI are used in tracking progress toward SDG Goal 8, promoting decent work and economic growth, and Goal 2, which encourages sustainable consumption and production.
How are economic data standardized?
Economic data are organized by internationally agreed statistical standards: the System of National Accounts (SNA) provides a complete, integrated system of accounts which enable international comparisons of all significant economic activity; the Balance of Payments (BoP) monitors a country’s international transactions; Government Finance Statistics monitors government incomes and expenditures; and the Monetary and Financial Statistics. Although the internationally agreed standards exist and the WDI presentation follows these standards, it should be noted that their implementation at national level varies.
What are the basic indicators of economic activity?
Measuring economic activity in a country or region provides insights into the economic well-being of its residents.
Gross Domestic Product (GDP), a widely used indicator, refers to the total gross value added by all resident producers in the economy. Growth in the economy is measured by the change in GDP at constant price. Many WDI indicators use GDP or GDP per capita as a denominator to enable cross-country comparisons of socioeconomic and other data.
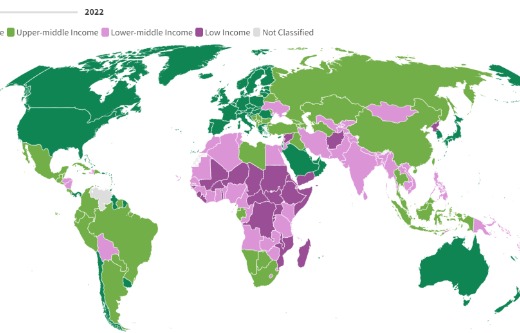
Also widely used in assessing a country’s wealth and capacity to provide for its people is Gross National Income (GNI) per capita - the sum of total domestic and foreign value added claimed by residents divided by total population. Furthermore, GNI per capita in U.S. dollars, converted from local currency using the Atlas method, is used to classify countries for operational purposes - lending eligibility and repayment terms. It is also used to classify economies into four main income groups for analytical purposes: low-income, lower-middle-income, upper-middle-income, and high-income. Further information on the operational and analytical classifications is available here. GNI per capita data are published every year in July for the previous year—data for 2017 will be published during the July 2018 update of the WDI database. However, some national data do not become available until later in the year.
Major updates for national accounts data occur every July and December. However data can be updated more often if countries revise their economic data monthly or quarterly, change methodology or coverage, or introduce new weights. Information on revisions between quarterly scheduled updates is available here.
Featured Indicators
A selection of relevant indicators is presented below. The table shows, for each featured indicator, time coverage per year, for all countries, for each decade since the 1960s, and regional coverage for each World Bank geographical region since 2010. For detailed thematic lists please refer to the World Development Indicators Statistical Tables.
| Growth and economic structure | ||||
|---|---|---|---|---|
| Indicator | Code | Time coverage | Region coverage | Get data |
|
GDP (current US$)
|
NY.GDP.MKTP.CD |


|


|
|
|
GDP growth (annual %)
|
NY.GDP.MKTP.KD.ZG |

|

|
|
|
Agriculture, value added (annual % growth)
|
NV.AGR.TOTL.KD.ZG |


|


|
|
|
Industry, value added (annual % growth)
|
NV.IND.TOTL.KD.ZG |
|

|
|
|
Manufacturing, value added (annual % growth)
|
NV.IND.MANF.KD.ZG |

|


|
|
|
Services, value added (annual % growth)
|
NV.SRV.TOTL.KD.ZG |

|

|
|
|
Final consumption expenditure (annual % growth)
|
NE.CON.TOTL.KD.ZG |
|


|
|
|
Gross capital formation (annual % growth)
|
NE.GDI.TOTL.KD.ZG |
|
|
|
|
Exports of goods and services (annual % growth)
|
NE.EXP.GNFS.KD.ZG |
|
|
|
|
Imports of goods and services (annual % growth)
|
NE.IMP.GNFS.KD.ZG |
|
|
|
|
Agriculture, value added (% of GDP)
|
NV.AGR.TOTL.ZS |
|
|
|
|
Industry, value added (% of GDP)
|
NV.IND.TOTL.ZS |
|
|
|
|
Services, value added (% of GDP)
|
NV.SRV.TOTL.ZS |
|
|
|
|
Final consumption expenditure (% of GDP)
|
NE.CON.TOTL.ZS |
|


|
|
|
Gross capital formation (% of GDP)
|
NE.GDI.TOTL.ZS |
|
|
|
|
Exports of goods and services (% of GDP)
|
NE.EXP.GNFS.ZS |
|
|
|
|
Imports of goods and services (% of GDP)
|
NE.IMP.GNFS.ZS |
|
|
|
| Income and savings | ||||
| Indicator | Code | Time coverage | Region coverage | Get data |
|
GNI per capita, Atlas method (current US$)
|
NY.GNP.PCAP.CD |
|

|
|
|
GNI per capita, PPP (current international $)
|
NY.GNP.PCAP.PP.CD |

|
|
|
|
Population, total
|
SP.POP.TOTL |
|

|
|
|
Gross savings (% of GDP)
|
NY.GNS.ICTR.ZS |
|


|
|
|
Adjusted net savings, including particulate emission damage (% of GNI)
|
NY.ADJ.SVNG.GN.ZS |
|


|
|
| Balance of payments | ||||
| Indicator | Code | Time coverage | Region coverage | Get data |
|
Export value index (2000 = 100)
|
TX.VAL.MRCH.XD.WD |
|
|
|
|
Import value index (2000 = 100)
|
TM.VAL.MRCH.XD.WD |
|
|
|
|
Personal remittances, received (% of GDP)
|
BX.TRF.PWKR.DT.GD.ZS |
|
|
|
|
Current account balance (% of GDP)
|
BN.CAB.XOKA.GD.ZS |
|
|
|
|
Foreign direct investment, net inflows (% of GDP)
|
BX.KLT.DINV.WD.GD.ZS |
|
|
|
| Prices and terms of trade | ||||
| Indicator | Code | Time coverage | Region coverage | Get data |
|
Consumer price index (2010 = 100)
|
FP.CPI.TOTL |
|
|
|
|
Export unit value index (2000 = 100)
|
TX.UVI.MRCH.XD.WD |
|
|
|
|
Import unit value index (2000 = 100)
|
TM.UVI.MRCH.XD.WD |
|
|
|
|
Net barter terms of trade index (2000 = 100)
|
TT.PRI.MRCH.XD.WD |
|
|
|
| Labor and productivity | ||||
| Indicator | Code | Time coverage | Region coverage | Get data |
|
GDP per person employed (constant 2011 PPP $)
|
SL.GDP.PCAP.EM.KD |
|
|
|
|
Unemployment, total (% of total labor force) (modeled ILO estimate)
|
SL.UEM.TOTL.ZS |
|
|
|
|
Agriculture, value added per worker (constant 2010 US$)
|
NV.AGR.EMPL.KD |
|
|
|
|
Industry, value added per worker (constant 2010 US$)
|
NV.IND.EMPL.KD |
|
|
|
|
Services, value added per worker (constant 2010 US$)
|
NV.SRV.EMPL.KD |
|
|
|
About the data
Growth and Structure
Growth in an economy is measured by change in the volume of its output or in the real expenditure or income of its residents. The 2008 System of National Accounts offers three approaches for estimating GDP: a production approach to find gross value added; an expenditure approach; and an income approach (no data in the WDI database use the income approach). In theory all should give the same estimate.
Production
The production approach first estimates the gross value of domestic output from the sectors of activity, agriculture, industry, and services. It then determines the intermediate value of the materials, supplies, and services used (intermediate consumption) to produce that output. Gross value added is the gross value of output minus the intermediate consumption. Formally, GDP at production is the sum of gross value added by all resident producers in the economy plus any product taxes (less subsidies) not included in the valuation of output.
Expenditure
The expenditure approach sums the following components: private expenditures for the consumption of durable and nondurable goods and services; investment in new non-financial assets or equipment, such as new housing, machinery, or software; government expenditure on final goods and services, including the wages of public employees; and gross exports minus gross imports (as the latter will have been included elsewhere). Formally, GDP from the expenditure side is the sum of the final consumption expenditures of households, government, and nonprofit institutions serving households; gross capital formation; and net exports (exports minus imports) of goods and services.
Income and Savings
Gross National Income
Gross National Income (GNI) measures total domestic and foreign value added claimed by residents. GNI comprises GDP plus net receipts of primary income (compensation of employees and property income) from non-resident sources. When calculating GNI in U.S. dollars, for internationally comparable data, the World Bank uses the Atlas method, which applies a three-year average of exchange rates (earlier years adjusted for relative inflation) to smooth the effects of transitory fluctuations in exchanges rates.
Due to large differences in price levels across economies, market exchange rate-converted GNI and GDP do not accurately measure the relative sizes of economies, wealth and the levels of material well-being. To overcome this, estimates are converted into international dollars using purchasing power parity (PPP) rates. PPPs measure the total amount of goods and services that a single unit of a country’s currency can buy in another country. PPPs can thus be used to convert the cost of a basket of goods and service into a common currency while eliminating price level differences across countries. In other words, PPPs equalize the purchasing power of currencies allowing comparison of real levels of expenditure between countries, just as a conventional price index allows comparison of real values over time.
The International Comparison Program (ICP) is the mechanism through which PPP rates are derived. The ICP coordinates the collection of price data for a common basket of goods and services in around 200 countries, applies appropriate weights to the different components of the basket, and calculates linking factors between regions to provide global PPPs. The latest PPP rates were released in 2014, and refer to the collection year 2011. The next round of PPP data will be featured in the WDI in 2020.
Adjusted net savings
How wealth changes over time is critical to understanding a country’s prospects for sustainable development. Adjusted Net Saving (ANS) was developed as an indicator to approximate change in wealth—based on simple economic theory in which savings equals investment, and investment equals the change in wealth. ANS measures gross national savings adjusted for gains (spending on education) and losses (consumption of fixed capital, depletion of subsoil assets and forests, pollution damages). Negative ANS may indicate that wealth is being run down, positive ANS that wealth is growing. ANS is useful in monitoring progress toward SDG Goal 12, which calls for sustainable management and efficient use of natural resources. For more information on ANS, visit the database page.
Balance of Payments
The Balance of Payments summarizes transactions between residents and nonresidents. It consists of the goods and services account, the primary income account, the secondary income account, the capital account, and the financial account. The International Monetary Fund (IMF) produces a widely used balance of payments dataset and methodology.
Current Account Balance
The current account balance is the sum of net exports of goods and services, net primary income, and net secondary income. It is a useful indicator of an external imbalance.
The trade balance is the difference between exports and imports of goods. From an analytical view it is arbitrary to distinguish goods from services. For example, a unit of foreign exchange earned by a freight company strengthens the balance of payments to the same extent as a similar unit earned by a goods exporter. Even so, the trade balance is useful because it is often the most timely indicator of trends in the current account balance. Customs authorities are typically able to provide data on trade in goods long before data on trade in services are available.
Export and import values are the current value of exports (free on board) or imports (cost, insurance, and freight) converted to U.S. dollars and expressed as the percentage of the average for the base period. See WDI online table 4.17 for current account values.
Balance of Payments Manual
In August 2012, the IMF implemented the Balance of Payments Manual 6 (BPM6) framework in its major statistical publications. Data conversion work undertaken by the IMF has made possible the presentation in the BPM6 format both for countries that reported data in BPM6 format and for those still compiling their data in BPM5 format. The World Bank implemented the BPM6 in its online databases and publications since April 2013. The complete balance of payments methodology can be accessed here.
Prices and Terms of Trade
Price inflation is the average rise in the price of goods and services within an economy. A commonly used measure of inflation is the consumer price index, which measures the prices of a representative basket of goods and services purchased by a typical household. Data on prices are collected at periodic intervals and appropriate weights are derived from household expenditure surveys. The Laspeyres formula for calculating price indices is generally used which measures the basket of goods at current prices using base year quantities.
Other price indices include the export price index which interprets the change in prices received by exporters, and the import price index which shows the change in prices paid by the importers. The terms of trade index measure the relative prices of a country’s exports and imports.
Labor Productivity
Labor productivity assesses a country economic ability to create and sustain decent employment opportunities with fair and equitable remuneration. Productivity increases obtained through investment, trade, technological progress, or changes in work organization can increase social protection and reduce poverty, which in turn reduce vulnerable employment (contributing family workers and own-account workers) and working poverty. Productivity increases do not guarantee these improvements, but without them—and the economic growth they bring—improvements are highly unlikely.
Output per worker
Productivity is often measured by output per unit of input. One indicator for labor productivity is GDP per person employed in constant 2011 PPP. The growth rate is used to monitor SDG Target 8.2: Achieve higher levels of economic productivity through diversification, technological upgrading, and innovation, including through a focus on high value-added and labor-intensive sectors. The World Development Indicators database also presents value added per worker by sector (agriculture, industry, and services). Visit People for more information on labor statistics.
Resources
World Bank Country and Lending Groups
How does the World Bank classify countries?
How are the income group thresholds determined?
Why use GNI per capita to classify economies into income groupings?