[goal: 1] calls for ending poverty by 2030. On the eve of the pandemic, 659 million people struggled on less than $2.15 a day. The pandemic halted years of progress in ending extreme poverty, expanding the number of extremely poor people by 70 million. Poor countries will need to grow to end extreme poverty and it can be done without significantly contributing to global emissions.
[target: 1.1] aims to end extreme poverty everywhere by 2030. Individuals live in extreme poverty if their daily income or consumption is below the international poverty line, currently set at $2.15 per day. Over the past decades, the world has made significant progress in ending extreme poverty.[reference: World Bank. 2022. [link: https://www.worldbank.org/en/publication/poverty-and-shared-prosperity Poverty and Shared Prosperity 2022: Correcting Course.] Washington, DC.]
Progress in ending extreme poverty
Distribution of income ($/day). Each dot represents 20 million people
Source: [link: https://pip.worldbank.org/ World Bank Poverty and Inequality Platform], World Development Indicators ([link: https://data.worldbank.org/indicator/SI.POV.DDAY SI.POV.DDAY]; [link: https://data.worldbank.org/indicator/SP.POP.TOTL SP.POP.TOTL]), and [link: https://www.worldbank.org/en/publication/poverty-and-shared-prosperity 2022 Poverty and Shared Prosperity Report].
In 1990, nearly [emphasis: 2 billion people] worldwide lived in extreme poverty – in other words, on less than $2.15 per day.
Between 1990 and 2019, the number of people living in extreme poverty was reduced by around 66 percent, from 2 billion to around [emphasis: 660 million].
Over the same period, the world’s population increased by around 2.4 billion people and the number of people with incomes above the international poverty line [emphasis: increased from 3.3 billion to 7 billion]. As a result, the share of the global population living in extreme poverty was reduced from about 38 percent to 8.5 percent.
This large reduction at the global level masks uneven progress at the regional level. In 1990, most of the extreme poor were located in [emphasis: East Asia and South Asia].
Between 1990 and 2019, extreme poverty decreased significantly in those regions thanks to strong economic growth.
By contrast, the number of extreme poor [emphasis: increased in Sub-Saharan Africa] over this time period. This is a result of rapid population growth – the share of people living in extreme poverty in Sub-Saharan Africa fell from 54 percent to 35 percent from 1990 to 2019.
Source: [link: https://pip.worldbank.org/ World Bank Poverty and Inequality Platform], World Development Indicators ([link: https://data.worldbank.org/indicator/SI.POV.DDAY SI.POV.DDAY]; [link: https://data.worldbank.org/indicator/SP.POP.TOTL SP.POP.TOTL]), and [link: https://www.worldbank.org/en/publication/poverty-and-shared-prosperity 2022 Poverty and Shared Prosperity Report].
The COVID-19 pandemic has reversed some of the progress made. In 2020, for the first time since the 1997 Asian financial crisis, the number of people living in extreme poverty increased.[reference: Mahler, Daniel Gerszon ⓡ Nishant Yonzan ⓡ Christoph Lakner. 2022. [link: https://openknowledge.worldbank.org/handle/10986/38114 The Impact of COVID-19 on Global Inequality and Poverty.] Policy Research Working Paper 10198. World Bank, Washington, DC.]
It is estimated that the number of extreme poor increased by about [emphasis: 70 million] in 2020.
Close to 11 percent more people lived in extreme poverty in 2020 compared to 2019. Since then, an uneven economic recovery, rising food prices, and conflict among some of the world’s biggest food producers have stalled progress further.[reference: World Bank. 2022. [link: https://www.worldbank.org/en/publication/poverty-and-shared-prosperity Poverty and Shared Prosperity 2022: Correcting Course.] Washington, DC.]
As a result, it has become more difficult to reach [target: 1.1] of ending poverty by 2030 unless the poorest countries grow at rates not seen before. Current projections suggest that in 2030, 574 million people, equivalent to nearly seven percent of the world’s population, will remain in extreme poverty.[reference: World Bank. 2022. [link: https://www.worldbank.org/en/publication/poverty-and-shared-prosperity Poverty and Shared Prosperity 2022: Correcting Course.] Washington, DC][reference: Schoch, Marta, Nishant Yonzan, Ruth Hill, and Christoph Lakner. 2022. [link: https://blogs.worldbank.org/developmenttalk/end-extreme-poverty-getting-back-pre-covid-19-reduction-rates-not-enough To end extreme poverty, getting back to pre-COVID-19 reduction rates is not enough.] World Bank Let’s Talk Development Blog. November 30.]
COVID-19 led to an increase in global poverty
Millions of poor globally
Note: This figure uses the September 2022 vintage of the global poverty data and hence deviates a little from the prior numbers, which use the March 2023 vintage.DataImageCopy Link
Source: [link: https://pip.worldbank.org/ World Bank Poverty and Inequality Platform], World Development Indicators ([link: https://data.worldbank.org/indicator/SI.POV.DDAY SI.POV.DDAY]; [link: https://data.worldbank.org/indicator/SP.POP.TOTL SP.POP.TOTL]), and [link: https://www.worldbank.org/en/publication/poverty-and-shared-prosperity 2022 Poverty and Shared Prosperity Report].
Where does the international poverty line come from?
These global trends are all based on the international poverty line of $2.15 per person per day – but where does this line come from?
[target: 1.2] requires countries to measure progress against a national poverty line. The international poverty line is derived from countries' own national poverty lines. Many low- and middle-income countries set these lines to reflect the basic needs that must be satisfied to escape poverty, often related to nutrition, clothing, shelter, and more. High-income countries, meanwhile, often set national poverty lines based on relative standards, such as obtaining an income higher than a fraction of the mean or median income of the country.
Where does the international poverty line come from?
Harmonized national poverty lines from circa 2017 ($/day)
In 2017, Tanzania’s national poverty line was the equivalent of $1.62 per person per day. [footnote: Tanzania’s poverty line is expressed in Tanzanian shillings. The national poverty lines can be harmonized and expressed in 2017 US dollars using exchange rates that account for purchasing power differences across countries. See [link: https://doi.org/10.1007/s10888-016-9327-5 Jolliffe and Prydz (2016)] and [link: https://openknowledge.worldbank.org/handle/10986/37061 Jolliffe ⓡ al. (2022)] for details.] This reflects what the country estimates to be the minimum necessary for long-term physical well-being: the cost of obtaining 2,200 daily calories per adult and an allotment for non-food basic needs.[reference: World Bank. 2019. [link: https://openknowledge.worldbank.org/handle/10986/33031 Tanzania Mainland Poverty Assessment.] Washington, DC.]
In the European Union, on the other hand, poverty is defined as the share of the population living below 60 percent of the median income. For France, in 2017 this established a poverty line of $27.39 per day.
In general, richer countries have higher national poverty lines.[reference: Jolliffe, Dean, and Espen Beer Prydz. 2021. [link: https://doi.org/10.1093/wber/lhz018 "Societal poverty: A relative and relevant measure."] The World Bank Economic Review 35, no. 1: 180-206.] In other words, the definition of basic needs depends on a country’s level of income. In poorer countries, for example, participating in the labor market may require only clothing and food, while in a richer country a person might need internet access, a vehicle, and a cell phone.
The fact that wealthier countries have higher national poverty lines becomes more evident if they are plotted as a function of their GDP per capita.
In order to compare poverty levels across countries, a poverty line that is fixed across countries is needed. The International Poverty Line reflects the typical poverty line of the poorest countries of the world. It is derived as the median national poverty line of all low-income countries.[reference: Jolliffe, Dean Mitchell ⓡ Daniel Gerszon Mahler ⓡ Christoph Lakner ⓡ Aziz Atamanov ⓡ Samuel Kofi Tetteh Baah. 2022. [link: https://openknowledge.worldbank.org/handle/10986/37061 Assessing the Impact of the 2017 PPPs on the International Poverty Line and Global Poverty.] Policy Research Working Paper 9941. Washington, DC: World Bank.]
The international poverty line was originally set by the World Bank at $1 a day in 1990 based on the national poverty lines of the poorest countries in the world at the time. Since then, inflation has increased the cost of basic goods in the poorest countries, and as a result this benchmark has been adjusted to $2.15 per day.
What if instead of using the typical poverty line of low-income countries, global progress were judged by how the typical high-income country defines poverty? In this case, a poverty line of $24.35 per day would be used.
The international poverty line reflects extreme poverty. Many people may live in impoverished conditions, even if they meet basic needs. If we use the poverty line typical of high-income countries, $24.35, then four-fifths of the world’s population is poor. Using this standard, 99 percent of people in Sub-Saharan Africa are living in poverty.
Select a country to see global poverty under that country’s definition of what it takes to be poor.
How many poor would there be if your country’s poverty line were used globally?
Source: [link: https://pip.worldbank.org/ World Bank Poverty and Inequality Platform], World Development Indicators ([link: https://data.worldbank.org/indicator/SI.POV.DDAY SI.POV.DDAY]; [link: https://data.worldbank.org/indicator/SP.POP.TOTL SP.POP.TOTL]), and [link: https://openknowledge.worldbank.org/handle/10986/37061 Jolliffe ⓡ al. (2022)].
Ending poverty without jeopardizing climate goals
[target: 1.1] is to eliminate global extreme poverty by 2030, which is interpreted as reaching a poverty rate of less than three percent. Unfortunately, many countries are still far from achieving that target. These countries will need to grow their economies substantially to eliminate poverty.
Past economic growth was accompanied by increased pressure on the climate through use of oil, coal and gas. If this pressure continues, achieving future growth could create a tension between the poverty goal, [goal: 1], and the climate goal, [goal: 13].
Growth is associated with poverty reduction and greenhouse gas emissions
Source: [link: https://openknowledge.worldbank.org/handle/10986/39475 Wollburg ⓡ al. (2023)], [link: https://pip.worldbank.org/ World Bank Poverty and Inequality Platform], World Development Indicators ([link: https://data.worldbank.org/indicator/NY.GDP.PCAP.PP.KD NY.GDP.PCAP.PP.KD]), and [link: https://www.climatewatchdata.org Climate Watch].
In general, a country’s GDP per capita is highly predictive of its extreme poverty rate. As countries grow, their extreme poverty rates tend to fall.
Take the case of China.
As its economy has grown more than 10-fold since 1991, its extreme poverty rate has fallen from more than 60 percent to close to zero.
But as the Chinese economy has grown and living standards have improved, so have energy needs: the use of electricity, cars, heating of homes and more. These energy needs were often met with fossil fuels which emit greenhouse gases and are drivers of climate change.[footnote: In recent years, however, China increased its greenhouse gases at a much slower rate than in prior years.]
China is not alone in this pattern. Economic growth is generally associated with rising greenhouse gas emissions.
This creates a dilemma. On one hand, growth is needed to reach the poverty target. But growth is often associated with greater energy needs and higher greenhouse gas emissions.[footnote: Greenhouse gases also exist from sources unrelated to energy, such as land-use change, agriculture, and industrial processes. These greenhouse gases are not correlated with countries’ income levels. Hence, there is less reason to expect that they would increase as countries grow. Though still problematic for containing climate change, these greenhouse gases do not create a strong tension between climate and poverty goals.]
Take the case of Mali, a country with high levels of extreme poverty.
As its economy has grown, so have its emissions.
It is estimated that Mali’s per capita income needs to nearly quadruple for the country to reach the three percent poverty target.[reference: Wollburg, Philip ⓡ Stephane Hallegatte ⓡ Daniel Gerszon Mahler. 2023. [link: https://openknowledge.worldbank.org/handle/10986/39475 "The Climate Implications of Ending Global Poverty."] Washington, DC: World Bank.]
In the past decade, most countries have gradually needed less energy for a given income level, by building more energy efficient buildings and more. Many countries have also emitted less greenhouse gases for a given energy level by expanding renewable energy sources. If the historical pace of progress continues over the coming decades, Mali needs a substantial increase in its energy emissions per capita to reach the poverty target.
But it is possible to limit the impact on climate while making strides in poverty reduction. [target: 7.3], which calls for countries to become more energy efficient, has a role to play. If Mali’s energy efficiency gains are similar to the top 10 percent seen across countries over the past decade, then the energy emissions per capita to reach the poverty target would only increase by 33 percent.
Another way for Mali to achieve these gains in a climate-friendly way is to grow in a manner that reduces income inequality, in line with [target: 10.1].[footnote: For information on recent progress made with respect to target 10.1, see [chapterlink: 8 Chapter 8], which explores the interaction between [target: 8.1] and [target: 10.1].] If the incomes of the poor grow faster than the rich, less growth is needed to lift the poorest above the poverty line, and less greenhouse gases will be emitted to reach the poverty target. Concretely, if Mali reduces inequality at a rate seen among the 10 percent best performers historically, the economy would need to double, instead of quadruple, for Mali to reach the poverty target.
Source: [link: https://openknowledge.worldbank.org/handle/10986/39475 Wollburg ⓡ al. (2023)], [link: https://pip.worldbank.org/ World Bank Poverty and Inequality Platform], World Development Indicators ([link: https://data.worldbank.org/indicator/NY.GDP.PCAP.PP.KD NY.GDP.PCAP.PP.KD]), and [link: https://www.climatewatchdata.org Climate Watch].
Greenhouse gas emissions needed to end poverty
There is a limited “carbon budget” – an amount of greenhouse gases that can be emitted globally to ensure that global warming stays within 1.5 degrees Celsius and avoid the most disastrous consequences of climate change. Much of this carbon budget has already been consumed by non-poor countries, and the world as a whole now needs to get to net-zero emissions within decades for temperatures not to rise above 1.5 degrees Celsius. Can the world reach the three percent poverty target without significantly adding to global warming?
Suppose all countries that currently have not met the three percent poverty target grow the necessary amount to reach the poverty target no later than 2050.[footnote: Even though the SDGs focus on 2030, as shown earlier in this story, current evidence suggests it will not be possible to reach the poverty target by then. For that reason, a target year of 2050 is used here.] How much would this add to the annual global emissions?
Baseline scenario
4.9%
of global 2019 emissions
If countries continue improving energy efficiency and adopting renewables at the pace of the past decade, the annual emissions needed for all countries to reach the three percent target by 2050 amounts to about five percent of global emissions in 2019. This would mean that eradicating extreme poverty only marginally increases the challenge of getting to net-zero by 2050.
Improving energy efficiency
3.0%
of global 2019 emissions
What is more, if all countries improve energy efficiency, as [target: 7.3] calls for, and improve at the pace of the top 10 percent highest gains seen across countries over the past decade, then reaching the poverty target only requires three percent of global annual emissions.
Reducing inequality
1.8%
of global 2019 emissions
If all countries meet [target: 10.1], experience pro-poor growth, and reduce inequality similar to the 10 percent greatest reductions seen historically, then reaching the poverty target requires less than two percent of annual emissions. Hence, progressive and sustainable policies will ease the tension between ending poverty and containing climate change.
These results might sound surprisingly low. Surely growth in countries like India, Indonesia, and Nigeria will have carbon consequences. Yet the greenhouse gas emissions of most poor countries are so low compared to high-income countries, that the growth needed to reach the poverty target adds little to global emissions.
Keep in mind also that the scenarios above calculate the carbon costs of ending extreme poverty, measured as the typical poverty line of low-income countries. If all countries need to eradicate poverty as defined by the typical upper middle-income country, $6.85 per day, it would require 46 percent of global emissions. This too, though, could be lowered if inequality is reduced, energy efficiency is improved, and the world shifts faster to renewables.
The scenarios show how poor countries can reduce any possible tension between ending poverty and containing global warming. Yet the responsibility to eradicate poverty in a manner compatible with containing climate change certainly does not fall on poor countries alone. In fact, since most global emissions come from wealthier nations, they can reduce the tension between the two goals with much smaller policy changes. If non-poor countries annually decarbonize their energy consumption 0.28 percent more than what they have done historically by shifting to renewables, they can entirely offset the emissions necessary to end extreme poverty.[reference: Wollburg, Philip ⓡ Stephane Hallegatte ⓡ Daniel Gerszon Mahler. 2023. [link: https://openknowledge.worldbank.org/handle/10986/39475 "The Climate Implications of Ending Global Poverty."] Washington, DC: World Bank.]
With the right policies, it is possible to achieve the goal of eliminating extreme poverty without severely degrading the environment. But it is critical to act fast – climate change is already pushing millions of people into poverty.[reference: Hallegatte, Stephane, Mook Bangalore, Laura Bonzanigo, Marianne Fay, Tamaro Kane, Ulf Narloch, Julie Rozenberg, David Treguer, and Adrien Vogt-Schilb. 2016. [link: https://openknowledge.worldbank.org/handle/10986/22787 Shock Waves : Managing the Impacts of Climate Change on Poverty.] Climate Change and Development. Washington, DC.]
Learn more about
SDG
1
In the charts below you can find more facts about SDG {activeGoal} targets, which are not covered in this story. The data for these graphics is derived from official UN data sources.
SDG target
1.2
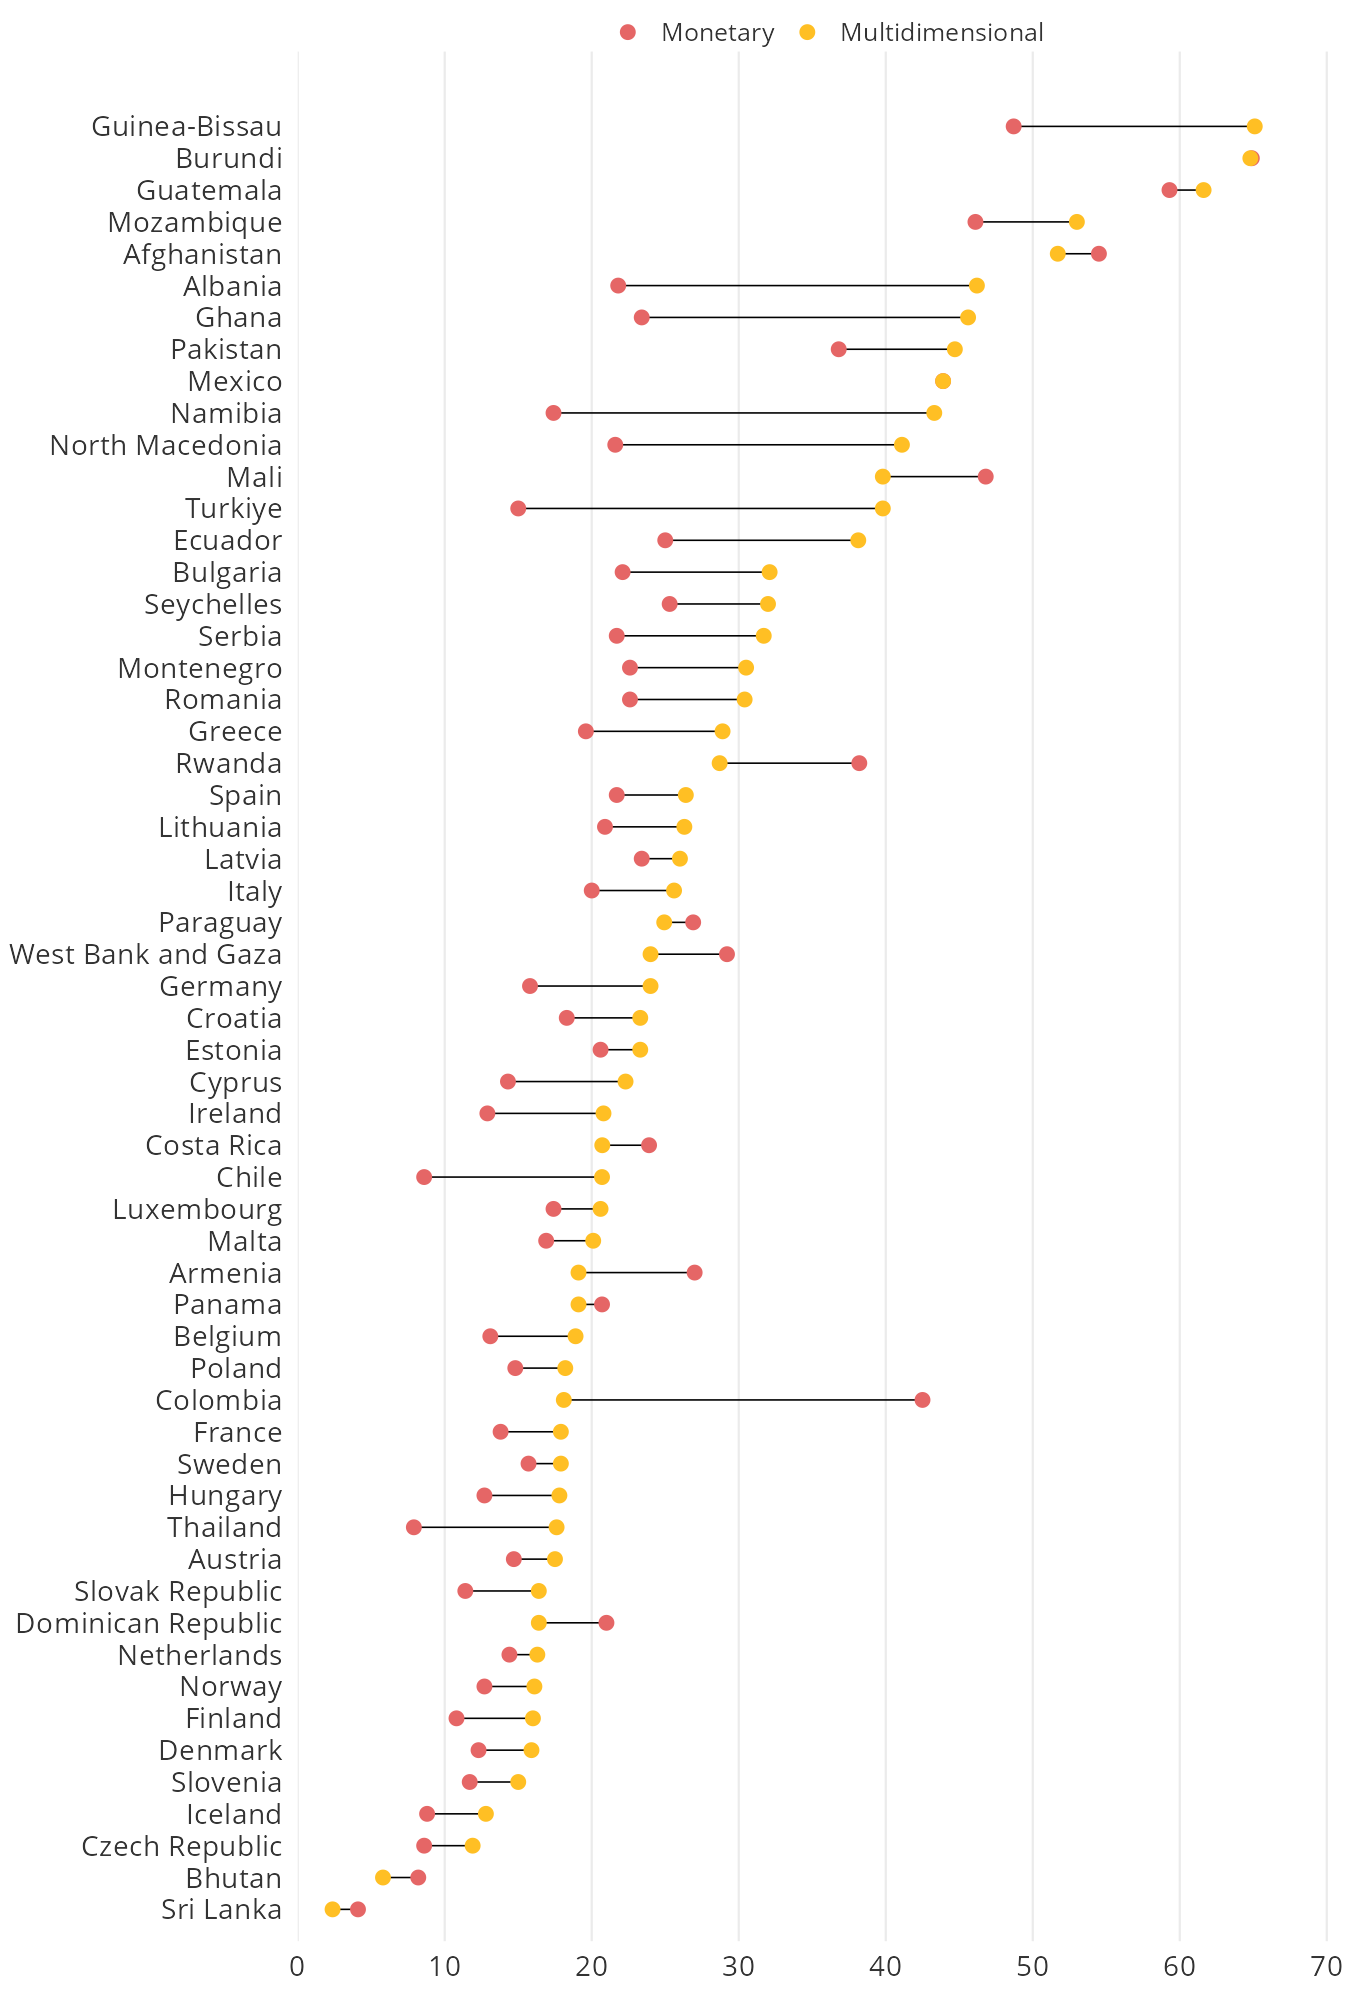
Multidimensional poverty captures other aspects of poverty such as education and health. In 44 out of 57 countries, it is higher than monetary poverty.
National monetary and multidimensional poverty rates (%)
* The figure includes countries with both a national monetary poverty rate (SDG 1.2.1) and multidimensional poverty rate (SDG 1.2.2) in the same year. For countries with multiple years of data available, the latest year is used.
Source: Government statistical agencies, Poverty and Inequality Platform, and World Development Indicators ([link: https://data.worldbank.org/indicator/SI.POV.NAHC SI.POV.NAHC], [link: https://data.worldbank.org/indicator/SI.POV.MDIM SI.POV.MDIM]).DOWNLOAD
SDG target
1.3
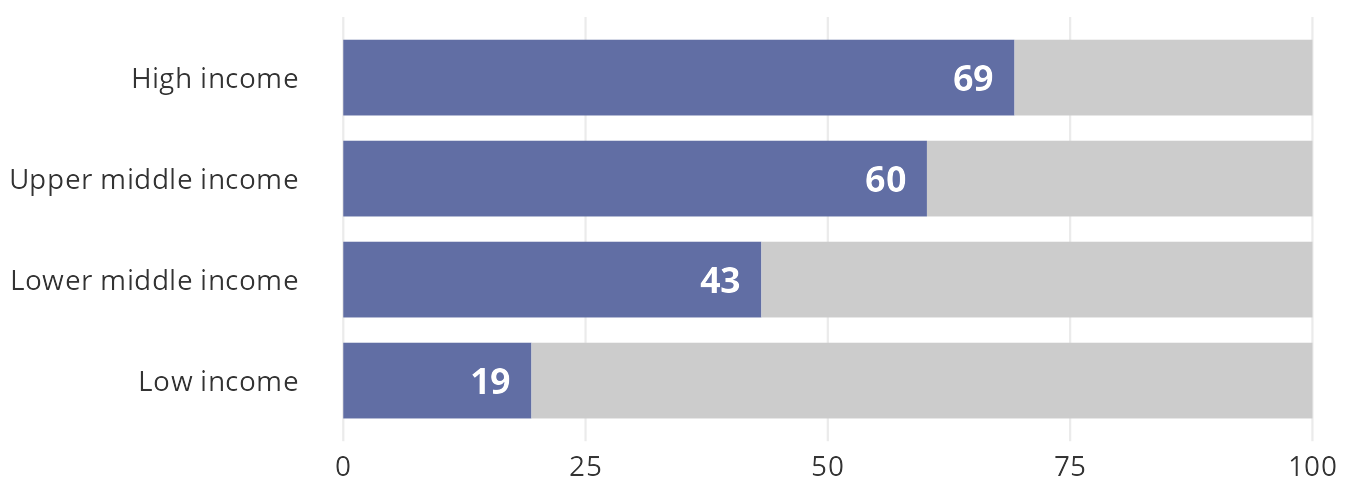
Low-income countries have little social protection
Proportion of population participating in social protection and active labor market programs (%), 2010-2019
* The figure only includes countries with at least one estimate for 2010-2019. When multiple estimates are available for the same country in the same decade, the latest value is used. Only data for eight high-income countries are available.
Source: The Atlas of Social Protection and World Development Indicators, World Bank (per_allsp.cov_pop_tot).DOWNLOAD