↓ Read the full story

Loading
[goal: 10] calls for reducing inequalities from several perspectives. This story will focus on income inequality as measured by the Gini index, an indicator of [target: 10.4] .[reference: United Nations Department of Economic and Social Affairs. 2017. [link: https://unstats.un.org/sdgs/indicators/Global%20Indicator%20Framework%20after%202022%20refinement_Eng.pdf Global Indicator Framework for the Sustainable Development Goals and Targets of the 2030 Agenda for Sustainable Development.] A/RES/71/313.]
Gini indices measure inequality on a scale from zero, indicating perfect equality, to 100, indicating one person having all resources. Countries’ income Ginis typically lie within a range of 25 to 60.[footnote: Some countries measure inequality using incomes while others use consumption expenditures. For simplicity both types of Ginis are referred to here as income Ginis or simply as Ginis without reference to either income or consumption. Income Ginis are typically higher than consumption Ginis.] The lowest Gini currently observed is 23 in Slovakia, while the highest is 63 in South Africa.[reference: World Bank. 2023. [link: https://pip.worldbank.org/ Poverty and Inequality Platform] (version 20230328_2017_01_02_PROD) [Data set] and World Development Indicators (SI.POV.GINI).]

Inequalities around the world vary greatly

Gini index of income or consumption, latest estimate available

Source: [link: https://pip.worldbank.org/ World Bank Poverty and Inequality Platform]. Retrieved from World Development Indicators ([link: https://data.worldbank.org/indicator/SI.POV.GINI SI.POV.GINI]).

The global Gini

62

in 2019

Ginis can also be calculated globally. The global Gini pools all people of the world together, adjusts their incomes for differences in purchasing power, and evaluates how far their incomes are from each other. This accounts for inequality within and among countries.
Inequality within countries concerns the degree to which individuals’ incomes in a country differ from each other while inequality between countries concerns the degree to which countries’ average incomes differ from each other. In Malawi, for example, average consumption in 2019 was less than $1,000 compared to more than $30,000 in the United States.[reference: World Bank. 2023. [link: https://pip.worldbank.org/ Poverty and Inequality Platform] (version 20230328_2017_01_02_PROD) [Data set] and World Development Indicators (SI.SPR.PCAP).] Because of the large differences in average incomes between countries, the global Gini tends to be higher than those in individual countries. In 2019, the global Gini was 62.[reference: World Bank. 2022. [link: https://www.worldbank.org/en/publication/poverty-and-shared-prosperity Poverty and Shared Prosperity 2022: Correcting Course.] Washington, DC.][reference: Mahler, Daniel Gerszon ⓡ Nishant Yonzan ⓡ Christoph Lakner. 2022. [link: https://openknowledge.worldbank.org/handle/10986/38114 The Impact of COVID-19 on Global Inequality and Poverty.] Policy Research Working Paper 10198. World Bank, Washington, DC.]

Global inequality declined until 2020 at which point the pandemic reversed the trend

Global Gini index

Source: [link: https://www.worldbank.org/en/publication/poverty-and-shared-prosperity 2022 Poverty and Shared Prosperity Report: Correcting Course] and [link: https://openknowledge.worldbank.org/handle/10986/38114 Mahler ⓡ al. (2022)].

The global Gini has [emphasis: fallen since 1990], from about [emphasis: 70] in 1990 to [emphasis: 62 in 2019], which represents significant progress in reducing global inequality.
This global progress might be surprising because inequality has risen in many western countries. In Sweden, for example, the Gini [emphasis: increased from 25 to 29] from 2003 to 2019.
But at the same time, inequality has fallen in many other countries. In Paraguay, the Gini [emphasis: fell from 55 to 46] during the same time period.
In addition, poorer countries have generally grown faster than richer countries, decreasing inequality between countries, which helps explain why the global Gini has declined.
Before the pandemic, World Bank projections suggested that the trend of declining inequality would continue. Unfortunately, [emphasis: because of the pandemic], in 2020 the world witnessed the [emphasis: largest increase] in global inequality [emphasis: since 1990].
This becomes more evident if one looks at the [emphasis: annual changes] in the global Gini.
[emphasis: 2020] stands out as the year with the largest increase in the Gini since 1990. [emphasis: Compared to the projections] conducted prior to the pandemic, the global Gini [emphasis: increased by 0.7] in 2020.

Source: [link: https://www.worldbank.org/en/publication/poverty-and-shared-prosperity 2022 Poverty and Shared Prosperity Report: Correcting Course] and [link: https://openknowledge.worldbank.org/handle/10986/38114 Mahler ⓡ al. (2022)].

An increase in the global Gini of 0.7 may seem like a minor change. What does it mean for a Gini index to change by this amount?

Interpreting Gini indices

Distribution of consumption in Belarus and Namibia

Annual consumption per capita (2017 USD)

Source: [link: https://pip.worldbank.org/ World Bank Poverty and Inequality Platform].

Let’s look at two countries, [emphasis: Belarus and Namibia], and reduce the entire distributions of these two countries to 100 percentiles, which can be thought of as 100 people, each represented by a dot. Intuitively, inequality says something about how far these dots are from each other – how far people’s incomes or consumption levels are from each other.
Yet what matters is [emphasis: not the absolute distance between the dots]. If that were the case, inequality would change if individuals’ income or consumption were measured annually instead of monthly. Since the annual amounts are larger, there would be larger absolute differences between individuals.
What matters is [emphasis: how far individuals are from each other in relative terms], or how much one has relative to others. As a result, we can rescale the vertical axis and express how much each person has compared with the average.
Suppose we pick two people in Namibia and ask how much would one need to transfer from the richer of the two to the poorer to make them equal?
In the case of these two people, it turns out to be around [emphasis: 557.8%] of the mean consumption. We can continue randomly selecting two people and determine how much we would need to [emphasis: transfer from the rich to the poor to make them equal].
Loading
Now imagine repeating this process continually. The average share of mean consumption that needs to be transferred to make two people equal gives you the Gini index. For [emphasis: Namibia] it is about [emphasis: 59] while for [emphasis: Belarus], it is about [emphasis: 25]. Hence, [emphasis: Namibia is more unequal] than Belarus.
Loading

Source: [link: https://pip.worldbank.org/ World Bank Poverty and Inequality Platform].

We can now interpret the increase in the global Gini of 0.7 caused by the pandemic. It means that the expected transfer to make two people equal requires 0.7 percent more of the average global income. Based on an average income of about $6,000 in 2020, this means it now takes $42 more to make two people equal. Though this may seem small, it represents more than a week’s income for more than 40 percent of the world’s population.

What drove the increase in the global Gini in 2020?

This increase in global inequality in 2020 could be driven by (1) poorer countries suffering more economically during the pandemic or (2) by poorer people within countries being harmed disproportionately by the pandemic compared with their wealthier peers.

What drove the increase in the global Gini in 2020?

Change in mean income in 2020 due to COVID by income level

Note: The dashed line is a linear fitted line. The changes in 2020 due to COVID-19 indicate the outcome in 2020 contrasted with an estimate of what would have happened to incomes in 2020 had COVID-19 not occurred.

Source: [link: https://www.worldbank.org/en/publication/poverty-and-shared-prosperity 2022 Poverty and Shared Prosperity Report: Correcting Course], [link: https://openknowledge.worldbank.org/handle/10986/38114 Mahler ⓡ al. (2022)], and [link: https://www.imf.org/en/Topics/imf-and-covid19/Fiscal-Policies-Database-in-Response-to-COVID-19 IMF Database of Fiscal Policy Responses to COVID-19].

The increase in global inequality was driven by poorer countries taking a bigger economic hit from the pandemic than richer countries. In particular, middle-income countries on average saw [emphasis: large negative shocks to average incomes]. Of all regions, South Asia saw the largest drop in 2020 incomes compared to what was expected before the pandemic.[reference: World Bank. 2023. [chapterlink: 8 Atlas of Sustainable Development Goals, Chapter 8.] Washington, DC.]
When looking at inequality within countries, there is no clear pattern. In some countries inequality increased, but in others, particularly rich countries, [emphasis: inequality fell]. Hence, we cannot say that poorer individuals within countries were systematically more economically harmed by the pandemic. In Brazil, for example, inequality fell, while in neighbouring Bolivia, Ecuador, and Peru, inequality increased.
There are many reasons why some countries saw inequality increase in 2020 and others saw declines. One factor relates to [target: 10.4], the response of governments, particularly their [emphasis: ability to deliver social protection to the poor].
Countries that [emphasis: responded to the pandemic by ramping up social spending] and/or by cutting taxes to help the most vulnerable often saw [emphasis: inequality decrease], while the opposite is often the case for those with little or no fiscal response. In the United States, for example, inequality in pre-tax incomes increased from 2019 to 2020, but due to progressive stimulus payments and tax credits, after-tax income inequality fell.[reference: Shrider, Emily A., Melissa Kollar, Frances Chen, and Jessica Semega. 2021. [link: https://www.census.gov/content/dam/Census/library/publications/2021/demo/p60-273.pdf Income and Poverty in the United States: 2020]. U.S. Government Publishing Office. Washington, DC.]

Source: [link: https://www.worldbank.org/en/publication/poverty-and-shared-prosperity 2022 Poverty and Shared Prosperity Report: Correcting Course], [link: https://openknowledge.worldbank.org/handle/10986/38114 Mahler ⓡ al. (2022)], and [link: https://www.imf.org/en/Topics/imf-and-covid19/Fiscal-Policies-Database-in-Response-to-COVID-19 IMF Database of Fiscal Policy Responses to COVID-19].

Reducing global inequality requires that the poorest nations close the gap with the wealthier ones and that the poorest people within each nation catch up with their less poor neighbours. This necessitates promoting universal, social, and political inclusion, in line with [target: 10.2], and ensuring equal opportunities and ending discrimination, in line with [target: 10.3].
Progress in other SDGs can also help. For example, if children get quality education, in line with [goal: 4], or if women are allowed to participate fully and equally in societies, in line with [goal: 5], then current and future income inequality will decline. Reducing inequality can also have positive spillovers on other SDGs, such as curbing poverty ([target: 1.1]) while containing climate change ([target: 13.2]).[reference: World Bank. 2023. [chapterlink: 1 Atlas of Sustainable Development Goals, Chapter 1.] Washington, DC.]

Learn more about SDG 10

In the charts below you can find more facts about SDG {activeGoal} targets, which are not covered in this story. The data for these graphics is derived from official UN data sources.

SDG target 10.7

Most refugees originate from and are hosted by low-income and lower middle-income countries

Refugees by area of origin and destination by income, 2000-2021 (in millions)


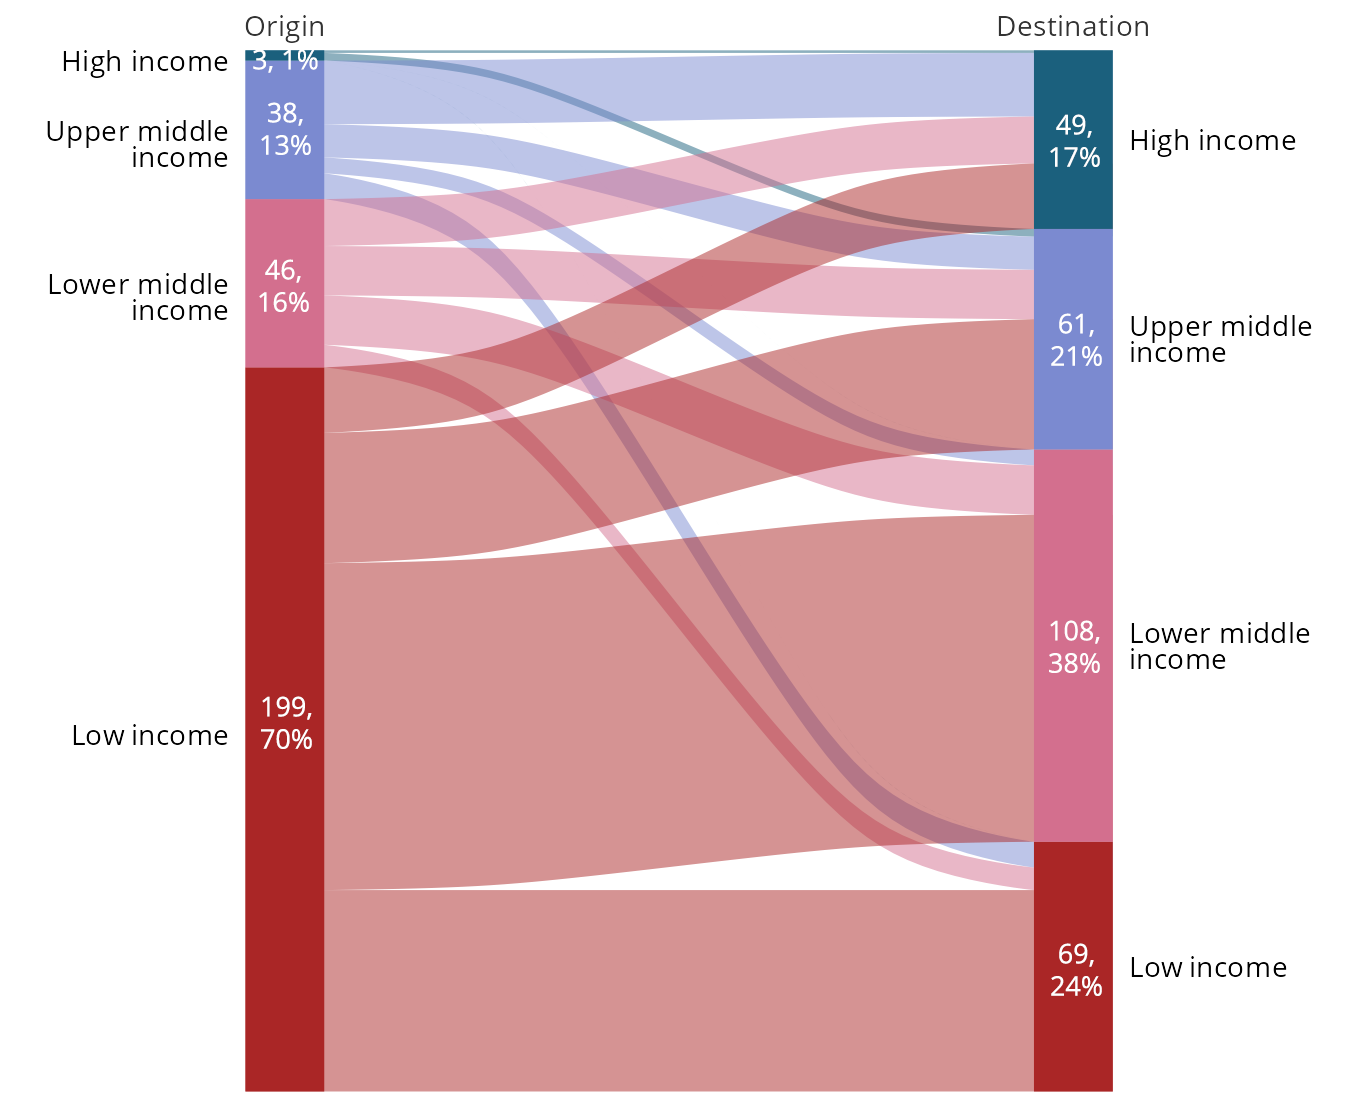
* The total count includes all refugees under the mandate of the United Nations High Commissioner for Refugees (UNHCR). In addition, there are about 6 million refugees under the mandate of the United Nations Relief and Works Agency for Palestine Refugees in the Near East (UNRWA).


Source: UNHCR, [link: unhcr.org/refugee-statistics Refugee Data Finder] and World Development Indicators, World Bank ([link: https://data.worldbank.org/indicator/SM.POP.REG.OR SM.POP.REFG.OR]). DOWNLOAD

SDG target 10.c

The cost of sending remittances remain well above the SDG target of 3 percent in most countries, particularly in Sub-Saharan Africa

Average transaction cost of sending remittances (%)


Source: Remittance Prices Worldwide. Retrieved from World Development Indicators ([link: https://data.worldbank.org/indicator/SI.RMT.COST.IB.ZS SI.RMT.COST.IB.ZS]). DOWNLOAD