[goal: 6] calls for ensuring availability and sustainable management of water and sanitation for all. Although access to clean water has increased in recent decades, population growth and climate change threaten to aggravate water scarcity in many countries. Since the 1960s, about two-thirds of countries have seen an increase in their level of water stress.
Over the past twenty years, global access to water has steadily increased.[reference: World Health Organization (WHO) and the United Nations Children’s Fund (UNICEF). 2021.[link: https://washdata.org/reports/jmp-2021-wash-households "Progress on household drinking water, sanitation and hygiene 2000-2020: five years into the SDGs."] Geneva. Retrieved from World Development Indicators [link: https://data.worldbank.org/indicator/SH.H2O.SMDW.ZS (SH.H2O.SMDW.ZS)].] Close to three quarters of the world population used safely managed drinking water services [target: 6.1] in 2020, up from 62 percent in 2000. However this progress is threatened by increasing demand for freshwater, and the impact of climate change on the water cycle.[footnote: The continuous circulation of water between air and land by water changing states between liquid, vapor, and ice.] This chapter will focus on [target: 6.4], which seeks to ensure sustainable usage and supply of freshwater, and avert water scarcity.
Freshwater is a limited resource
Looking at the Earth, water may seem abundant. But freshwater, non-saline water that can be used for irrigation and consumed by humans, is limited.
Freshwater represents only [emphasis: 2.5 percent] of the total amount of water available on the planet.
Easily accessible surface freshwater accounts for less than 1% of the total
Source: Igor Shiklomanov's chapter "World fresh water resources" in Peter H. Gleick (editor), 1993, Water in Crisis: A Guide to the World's Fresh Water Resources (Oxford University Press, New York). Retrieved from [link: https://www.usgs.gov/special-topics/water-science-school/science/where-earths-water the United States Geological Survey Water Science School.]
This square represents 100 percent of the water that is available on Earth.
The vast majority (97.5 percent) of Earth’s water is saline. Only 2.5 percent of Earth’s water is freshwater.
More than two-thirds of all freshwater (69 percent) is locked up in glaciers, and therefore not accessible.
Groundwater constitutes the largest component of the remaining freshwater. It is the main source of water supplies in many countries, even though it is sequestered below the Earth, and only accessible through drilling.
The amount of surface water
The rest is other freshwater such as soil moisture.
Source: Igor Shiklomanov's chapter "World fresh water resources" in Peter H. Gleick (editor), 1993, Water in Crisis: A Guide to the World's Fresh Water Resources (Oxford University Press, New York). Retrieved from [link: https://www.usgs.gov/special-topics/water-science-school/science/where-earths-water the United States Geological Survey Water Science School.]
Freshwater is unevenly distributed
The amount of available freshwater varies widely from country to country. Some countries are rich in surface waters, and enjoy abundant precipitation,[footnote: Water released from clouds in the form of rain, freezing rain, sleet, snow, or hail. Source: [link: https://www.usgs.gov/special-topics/water-science-school/science/precipitation-and-water-cycle United States Geological Survey Water Science School]] while others have no surface water resources, and see little rain or snow.
Heat from the sun helps create continuous circulation from sea to air to land as water alternates its states of liquid, vapor, and ice: This is called the water cycle. Renewable freshwater resources are generated from this cycle, which is a direct consequence of countries’ geographical position. This determines the water supply, which can come from rainfall over the territory, as well as from upstream rivers or aquifers, which may be shared with neighboring countries. Thus, the renewable freshwater supply is essentially finite, even though the amount available in any given area varies from year to year due to rainfall variability.[reference: M Falkenmark, J Lundqvist, C Widstrand. 1989. [link: https://pubmed.ncbi.nlm.nih.gov/12317608/ “Macro-scale water scarcity requires micro-scale approaches. Aspects of vulnerability in semi-arid development.”] Natural Resources Forum 13(4):258-67]
The global map shows the disparities of annual precipitation among regions
Source: [link: https://climateknowledgeportal.worldbank.org/ World Bank Climate Change Knowledge Portal]
Water is indispensable for humans. We need it to stay hydrated, prepare food, and maintain good hygiene. Besides such domestic use, water is an essential input to agriculture and for other goods and services. These non-domestic uses are by far the most intensive. While the UN calculates[reference: [link: https://www.un.org/en/global-issues/water United Nations Global Issues: Water]] that a person needs 50 to 100 liters of water per day to meet basic drinking, cooking, and hygiene needs, the Food and Agriculture Organization (FAO) estimates[reference: FAO (Food and Agriculture Organization). 2017. [link: https://www.fao.org/3/i7959e/i7959e.pdf “Water for Sustainable Food and Agriculture: A report produced for the G20 Presidency of Germany.“]] that “between 2,000 and 5,000 liters of water are needed to produce a person’s daily food needs”. Water is also critical for electricity production[footnote: 90 percent of global power generation is water intensive. Source: WWAP (United Nations World Water Assessment Programme). 2014. [link: https://unesdoc.unesco.org/ark:/48223/pf0000225741 The United Nations World Water Development Report 2014: Water and Energy.] Paris, UNESCO.] and sustaining biodiversity and ecosystems.[reference: [link: https://www.unwater.org/water-facts/water-and-ecosystems UN-Water: Water and Ecosystems]]
In most countries, per capita water resources have been steadily decreasing
Availability of water resources per capita (m3 per capita per year)
This is the distribution of per-capita water availability in 1964.
The blue band on the left represents the minimum amount of water needed per capita to meet basic drinking, cooking and hygiene needs: 50 to 100 liters of water per day (converted to per capita m3 per year on the chart).
This second blue bar represents the amount of water required to meet a person’s food production needs: 2,000 to 5,000 liters per capita per day (converted to per capita m3 per year on the chart). A lot of water is needed to grow crops and produce food. This amount may vary substantially depending on a country’s climate and other factors.
Amid population growth, more countries moved to the left, below the minimum threshold of per capita water for basic needs and food production.
China has seen a decrease of about 50 percent in its per capita water availability between 1964 and 2020.
In Pakistan, availability of water resources per capita has been reduced by 80 percent between 1964 and 2020.
Global freshwater withdrawal is estimated to have more than doubled since 1960.[reference: UN-Water. 2021. [link: https://www.unwater.org/sites/default/files/app/uploads/2021/10/UN-Water-analytical-brief-Water-use-efficiency_October2021.pdf “UN-Water Analytical Brief on Water Use Efficiency.”]Geneva.] The large amount of water needed for food production means that water resources are predominantly allocated to the agricultural sector. Population growth is one of the primary drivers of increased water demand, as is economic growth. In addition, policy distortions and water mismanagement can contribute to water scarcity: Water underpricing and agricultural subsidies for instance, may lead to excessive use.
Water withdrawal has increased in many countries
Total freshwater withdrawal (billion m3/year) and Total population
Source: [link: http://fao.org/aquastat/statistics/query/index.html?lang=en FAO Aquastat database]. Retrieved from World Development Indicators ([link: https://data.worldbank.org/indicator/ER.H2O.FWTL.K3 ER.H2O.FWTL.K3], [link: https://data.worldbank.org/indicator/SP.POP.TOTL SP.POP.TOTL]).
Water is essential to human needs, and a critical input to food production. Population growth naturally leads to more pressure on water resources, as illustrated by the correlation between population size and water withdrawals.
While that correlation holds at the global level, there is significant variation from country to country.
In Uruguay for instance, water withdrawals have increased much faster than the population. This is partly explained by Uruguay’s agricultural sector’s specialization in water intensive products like beef, soybeans, and rice.
In contrast, owing to more efficient use of water resources, the United States has managed to withdraw less water over the same period of time, despite of a growing population.
Source: [link: http://fao.org/aquastat/statistics/query/index.html?lang=en FAO Aquastat database]. Retrieved from World Development Indicators ([link: https://data.worldbank.org/indicator/ER.H2O.FWTL.K3 ER.H2O.FWTL.K3], [link: https://data.worldbank.org/indicator/SP.POP.TOTL SP.POP.TOTL]).
Around [emphasis: 70 percent] of global freshwater resources are used for [emphasis: agriculture].
In low-income countries, water use in agriculture accounts for 90 percent of all water withdrawals. This is significantly less in high-income countries (44 percent), where a higher share of water goes to the industrial sector.
Agriculture is the main sector of water use
Water withdrawal by sector (% of total freshwater withdrawal) by income group, 2020
Source: [link: http://fao.org/aquastat/statistics/query/index.html?lang=en FAO Aquastat database]. Retrieved from World Development Indicators ([link: https://data.worldbank.org/indicator/ER.H2O.FWTL.K3 ER.H2O.FWTL.K3], [link: https://data.worldbank.org/indicator/ER.H2O.FWAG.ZS ER.H2O.FWAG.ZS], [link: https://data.worldbank.org/indicator/ER.H2O.FWIN.ZS ER.H2O.FWIN.ZS], [link: https://data.worldbank.org/indicator/ER.H2O.FWDM.ZS ER.H2O.FWDM.ZS]).
Between 1960 and 2018, water withdrawals increased by 100 percent in agriculture, 90 percent in industry, and 300 percent in domestic use.[reference: UN-Water. 2021. [link: https://www.unwater.org/sites/default/files/app/uploads/2021/10/UN-Water-analytical-brief-Water-use-efficiency_October2021.pdf “UN-Water Analytical Brief on Water Use Efficiency.”] Geneva.] Although water use is becoming more efficient[reference: FAO (Food and Agriculture Organization). 2021. [link: https://www.fao.org/documents/card/en/c/cb6413en “Progress on change in water-use efficiency: Global Status and Acceleration Needs for SDG Indicator 6.4.1.”] Rome.] across all economic sectors, global demand for water is expected to keep increasing due to economic and population growth.[reference: WWAP (UNESCO World Water Assessment Programme). 2019. [link: https://unesdoc.unesco.org/ark:/48223/pf0000367306 “World Water Development Report 2019: Leaving No One Behind.”] Paris.] This growth is adding to pressure on water resources, while at the same time the water cycle is being impacted by climate change – two factors which may limit freshwater availability. It is therefore essential to monitor stress on water resources as an early warning indicator of potential scarcity.
Water stress: from global to local
Understanding water stress: What is water stress?
There are different ways of defining water stress.[footnote: Please see the following [link: https://www.mdpi.com/2073-4441/13/2/201 article.]] In this story, we will use the water stress indicator defined in SDG 6.4.2.[reference: United Nations Statistics Division. SDG Indicators Metadata repository. [link: https://unstats.un.org/sdgs/metadata/files/Metadata-06-04-02.pdf “Indicator 6.4.2: Level of water stress - Definition and methodology”].] The water stress indicator seeks to estimate the amount of pressure on a country’s renewable freshwater resources.[footnote: The indicator for water stress does not consider human-made increases in water supply (such as desalination), and ignores water withdrawals that are recycled and reused.] It is defined as the ratio of total freshwater withdrawals divided by the available renewable freshwater.
The closer a country gets to 100 percent, the more pressure it places on its water resources. In some cases, the value of 100 percent can even be exceeded. This happens when a country consumes water resources that are non-renewable. This is the case for instance, when water is extracted from the non-renewable reserves of an aquifer, generally referred to as fossil groundwater.[reference: UNESCO (United Nations Educational, Scientific and Cultural Organization). 2006. [link: https://unesdoc.unesco.org/ark:/48223/pf0000146997 “Non-renewable groundwater resources.”] Paris.]In such cases, countries are over-extracting their water resources.
Countries can face water stress even if they are not over-extracting. The FAO classifies countries into five categories of water stress: None (<25 percent), Low (25-50 percent), Medium (50-75 percent), High (75-100 percent), and Critical (>100 percent).
While low water stress indicates sustainable usage, it is important to note that this is not necessarily a positive outcome: it may indicate the inability of a country to properly manage its water resources for the benefit of its population. In some low-income countries, water stress levels are very low, but access levels are also low. For example, the level of water stress in Uganda is just 5.8 percent but only 17 percent of the population have access to safely managed drinking water.[reference: World Health Organization (WHO) and the United Nations Children’s Fund (UNICEF). 2021.[link: https://washdata.org/reports/jmp-2021-wash-households "Progress on household drinking water, sanitation and hygiene 2000-2020: five years into the SDGs."] Geneva. Retrieved from World Development Indicators [link: https://data.worldbank.org/indicator/SH.H2O.SMDW.ZS (SH.H2O.SMDW.ZS)].] The water stress indicator signals the importance of effective supply and demand management policies.[reference: FAO (Food and Agriculture Organization) and UN-Water. 2021. [link: https://doi.org/10.4060/cb6241en “Progress on the level of water stress: Global status and acceleration needs for SDG indicator 6.4.2, 2021.”] Rome.]
The global picture
Share of countries with increased level of water stress
~67 %
Worldwide, 2020
The global water stress level was 18 percent in 2020,[reference: Retrieved from [link: https://unstats.un.org/sdgs/dataportal/database UN SDG Portal (6.4.2)].]which is classified as “no stress” according to FAO. However, this masks variations among countries. About two-thirds of countries have seen an increase in their level of water stress since the 1960s.
Water stress is a serious concern across the world
Level of water stress (%) by countries, 2020, and by major river basin, 2018
Source: [link: http://fao.org/aquastat/statistics/query/index.html?lang=en FAO Aquastat database]. Retrieved from World Development Indicators ([link: https://data.worldbank.org/indicator/ER.H2O.FWST.ZS ER.H2O.FWST.ZS]).[link: https://data.apps.fao.org/catalog/iso/40bc32f6-1467-44ac-8f7c-3d67cbb1cbd7 FAO. Level of Water Stress (SDG 6.4.2) by Major River Basin].
Countries with critical or high stress levels are concentrated in the Middle East and North Africa (MENA) region where available water resources are scarce. Some countries depend heavily on desalinated water, with the region hosting about 50 percent of the world’s desalination capacity according to FAO.[reference: FAO (Food and Agriculture Organization). 2022. [link: https://www.fao.org/documents/card/en/c/cc0265en “The State of Land and Water Resources for Food and Agriculture in the Near East and North Africa region –Synthesis report”].] Water intensive products are also imported, rather than locally produced, to compensate for the lack of local water resources.[reference: World Bank. 2018. [link: https://openknowledge.worldbank.org/entities/publication/62f75eb4-5488-50dc-9bb5-b54b12a32ac0 “Beyond Scarcity : Water Security in the Middle East and North Africa”.] MENA Development Report. Washington, DC. ]
With a water stress level of [emphasis: 116 percent] in 2020, Pakistan, a South Asian country, has one of the highest water withdrawals in the world. To meet its growing demand, Pakistan draws heavily from its aquifers. It is the fourth largest user of groundwater in the world behind India, China, and the United States.[reference: Margat, J., and J. van der Gun. 2013. Groundwater around the World. CRC Press/Balkema. Retrieved from [link: https://www.ngwa.org/what-is-groundwater/About-groundwater/facts-about-global-groundwater-usage National Ground Water Association].] FAO notes that this over-extraction of groundwater is pushing the country toward a widening supply-demand gap that has created a need to improve water management.
Singapore also has a high level of stress (83 percent) due to a lack of freshwater resources and limited land for water storage. However, it has improved the way water is managed by cutting demand and increasing supply.[reference: Singapore’s National Water Agency. [link: https://www.pub.gov.sg/watersupply/singaporewaterstory Singapore Water Story].] Singapore has diversified its resources by using treated wastewater and desalinated water. It has also invested heavily in underground drainage systems and dams, research and development, and in running public awareness campaigns to conserve water.
Water is a local resource and availability and usage can vary within countries. On average, South American countries do not suffer from water stress, but specific local conditions can be different.
A river basin is the area of land drained by a river and its tributaries. Looking at water stress at the river basin level, as shown on the map, we get a more nuanced picture of water stress in South America.
Northern Chile, for instance, lies in an area of critical water stress, due to its dry climate, water intensive agriculture and mining activities. Southern Chile on the other hand, does not have this problem.
Water stress can vary within the borders of a single country. At the same time, water basins do not stop at country borders, and may be shared by multiple countries.
This is the case of the Nile, one of the largest basins in the world, covering approximately 10 percent of the African continent, and shared by eleven countries in Northeast Africa: Burundi, the Democratic Republic of the Congo, Rwanda, Uganda, Tanzania, Kenya, South Sudan, Ethiopia, Sudan, Eritrea, and Egypt.[reference: FAO (Food and Agriculture Organization). 2011. [link: https://www.fao.org/3/i2615e/i2615e.pdf “Information Products for Nile Basin Water Resources Management”]. Synthesis Report.]
The population of these countries has nearly quadrupled (143 million in 1971 to 564 million in 2021) over the past 50 years,[reference: Retrieved from World Development Indicators [link: https://data.worldbank.org/indicator/SP.POP.TOTL (SP.POP.TOTL)].] and is projected to keep increasing. The growing demand for water puts pressure on the Nile River Basin, where water flows are already fully used to meet various domestic, agricultural and industrial demands. FAO describes the allocation of the Nile water across countries as a zero-sum game.[reference: FAO (Food and Agriculture Organization). 2011. [link: https://www.fao.org/3/i2615e/i2615e.pdf “Information Products for Nile Basin Water Resources Management”]. Synthesis Report.] Managing such a shared resource can be complex. The Nile Basin Initiative[reference: The World Bank. 2019. [link: https://www.worldbank.org/en/news/feature/2019/02/22/stronger-together-20-years-of-cooperation-around-the-nile “Stronger Together: 20 Years of Cooperation Around the Nile”]. Feature Story. February 22, 2019.] was created in 1999 to facilitate cooperation across countries for the sustainable management of water in this region.
Source: [link: http://fao.org/aquastat/statistics/query/index.html?lang=en FAO Aquastat database]. Retrieved from World Development Indicators ([link: https://data.worldbank.org/indicator/ER.H2O.FWST.ZS ER.H2O.FWST.ZS]).[link: https://data.apps.fao.org/catalog/iso/40bc32f6-1467-44ac-8f7c-3d67cbb1cbd7 FAO. Level of Water Stress (SDG 6.4.2) by Major River Basin].
The Nile basin is a striking example of transboundary water resources, but it is not isolated: At least 310 of the world’s river basins are shared by at least two countries, and the majority of global freshwater flows (60 percent) comes from these basins.[reference: Carius, Alexander, Geoffrey d. Dabelko, and Aaron T. Wolf. 2004. [link: https://www.wilsoncenter.org/sites/default/files/media/documents/publication/ecspr10_unf-caribelko.pdf “Water, Conflict, and Cooperation”.] Environmental Change and Security Program Report Issue 10, 60-66. Wolf, Aaron T., Annika Kramer, Alexander Carius, and Geoffrey D. Dabelko. 2005. [link: https://transboundarywaters.science.oregonstate.edu/sites/transboundarywaters.science.oregonstate.edu/files/Publications/Wolf%20-%20SOW%2005%20chap5.pdf “Managing Water Conflict and Cooperation”]. In State of the world 2005: A Worldwatch Institute Report on progress toward a sustainable society: global security. 80-99.]
At least [emphasis: 310] of the world’s river basins are shared by at least two countries.[reference: McCracken, Melissa, and Aaron T. Wolf. 2019.[link: https://doi.org/10.1080/07900627.2019.1572497 “Updating the Register of International River Basins of the World”. International Journal of Water Resources Development. Volume 35, Issue 5.732-782.]]
In many regions, economic development and population growth have put pressure on freshwater resources. Climate change represents an additional challenge as it is already impacting, and will likely continue to affect the quality and quantity of water in many river basins.[reference: Caretta, M.A., et.al., 2022. [link: https://www.ipcc.ch/report/ar6/wg2/ Water. In: Climate Change 2022: Impacts, Adaptation, and Vulnerability. Contribution of Working Group II to the Sixth Assessment Report of the Intergovernmental Panel on Climate Change].] Climate change intensifies the water cycle, increasing evaporation and precipitation. Regions with high rainfall will see more rainfall during shorter periods of time (increased risk of flooding), while arid and semi-arid regions will receive less rain over longer periods of time, creating an increased drought risk.[reference: OECD (Organisation for Economic Co-operation and Development). 2013. [link: https://doi.org/10.1787/9789264200449-en “Water and Climate Change Adaptation: Policies to Navigate Uncharted Waters”, OECD Studies on Water, OECD Publishing.]] This situation calls for extended institutional collaboration, and is forcing governing bodies to rethink their water management practices. This is happening in the Colorado River Basin.
Case Study: Colorado River Basin
Water crisis in Southwest United States
The United States, as a country, has a low water stress level (28 percent), but there are large regional differences. [link: https://www.usbr.gov/uc/img/crsp/CRBMap.jpg The Colorado River Basin], located in the Southwest, has a high level of water stress (79 percent). The Colorado River is about 1,450 miles long (2,334 km) and the basin area includes seven states (Wyoming, Utah, Colorado, New Mexico, Arizona, Nevada, California), and parts of northern Mexico. The river is an important water source: It irrigates nearly 4.5 million acres (18,210 km2) of agricultural lands, generates more than 4,200 megawatts of electrical capacity per year, and provides water to around 40 million people.[reference: Bureau of Reclamation, U.S. Department of Interior. 2021. [link: https://www.usbr.gov/climate/secure/docs/2021secure/basinreports/ColoradoBasin.pdf Colorado River Basin—SECURE Water Act Section 9503(c)—Report to Congress. ]] The majority of this region has an arid or semi-arid climate.[footnote: Defined by precipitation per year: 0-250 mm for arid climate and 250-500 mm for semi-arid climate.] In addition, the basin has had a severe drought since 2000. According to the United States Bureau of Reclamation, the period from 2000 through 2018 was the driest 19-year period in over 100 years of record keeping.[reference: United States Bureau of Reclamation. 2019. [link: https://www.usbr.gov/lc/region/g4000/aop/AOP19.pdf “Annual Operating Plan for Colorado River reservoirs, 2019”].] For the first time ever, the federal government officially declared a water shortage in the Colorado River in 2021. Lake Mead, the largest reservoir in the U.S. in terms of water capacity, is used to illustrate the declining water levels in the Colorado River Basin.
Declining water levels in Lake Mead
Lake Mead is the largest reservoir in the United States by volume, and was formed in 1936 following the construction of the Hoover Dam. Its water level has declined since 2000.
In July 2022, the storage level of Lake Mead recorded its lowest level, at 26.9 percent.
The water level in Lake Mead has declined over the past 22 years
Percent of full operational capacity (26,120,000 acre-feet) by month (last day of the month)
Source: [link: https://www.usbr.gov/lc/riverops.html United States Bureau of Reclamation]
The chart shows [footnote: Lake Mead storage is constantly evolving. A number of subsequent studies have been conducted to determine its current storage capacity. The bathymetric studies were conducted from 1948 to 1949, 1963 to 1964, and 2001. The United States Bureau of Reclamation doesn’t overwrite the historical values for content after new studies. For this chart, we have calculated the percentage of storage capacity based on the latest full operation capacity in Lake Mead (which is 26,120,000 acre-feet). References: Bureau of Reclamation. 2011. [link: https://www.usbr.gov/lc/region/g4000/LM_AreaCapacityTables2009.pdf Lake Mead Area and Capacity Tables], [link: https://www.nps.gov/lake/learn/nature/storage-capacity-of-lake-mead.htm National Park Service’s website: Storage Capacity of Lake Mead] ] the monthly percentage of full capacity from May 1937 to September 2022.
The horizontal lines represent various levels of shortage conditions. Shortage conditions levels are defined under [link: https://www.usbr.gov/ColoradoRiverBasin/#GuidelineOperation the Drought Contingency Plan ].
Starting around 2000, the storage level of Lake Mead has been almost continuously declining. Since 2013, it has been below 50 percent.
In May 2021, the storage level fell below the Tier 1 water shortage level (around 37 percent full capacity) for the first time.
Source: [link: https://www.usbr.gov/lc/riverops.html United States Bureau of Reclamation]
Source: NASA Earth Observatory. United States National Aeronautics and Space Administration. [link: https://earthobservatory.nasa.gov/images/150111/lake-mead-keeps-dropping “Image of the Day for July 22, 2022: Lake Mead Keeps Dropping.”]
Imbalance of water supply and demand
Each year, 16.5 million acre-feet (MAF) (20.3 km3) per year of water [footnote: Roughly equivalent to 8 million Olympic-sized swimming pools. Source: [link: https://regioncwater.org/glossary/acre-foot/ The Region C Water Planning Group]] from the Colorado River is shared across seven U.S. states and Mexico. This is based on [link: https://www.usbr.gov/lc/region/pao/pdfiles/crcompct.pdf the 1922 Colorado River Compact], the foundational document governing the basin’s water management. When the Compact was created, the Colorado River’s annual flow was estimated at around 18 MAF (22.3 km3) per year.[reference: Koebele, Elizabeth and Max Robinson. 2021. [link: https://www.unr.edu/nevada-today/blogs/2021/impact-of-colorado-river-shortages-on-nevada “The impact of Colorado River water shortages on Nevada: Changes to water policy needed as time runs out.”] Nevada Today, November 12, 2021]
Between 2000-2020, the annual flow declined to 12.5 MAF (15.4 km3) per year,[reference: Bureau of Reclamation. [link: https://www.usbr.gov/lc/region/g4000/NaturalFlow/current.html Colorado River Basin Natural Flow and Salt Data.]] but a total of 16.5 MAF (20.3 km3) per year of water is still being allocated to the U.S. states and Mexico.
Impact of the water shortage conditions in the southwest region
To prevent further depletion of water resources, the federal government set the guidelines[reference: Bureau of Reclamation. [link: https://www.usbr.gov/ColoradoRiverBasin/#InterimGuidelines Colorado River Interim Guidelines for Lower Basin Shortages and Coordinated Operations for Lake Powell and Lake Mead].] governing Colorado River operations.
For the first time ever, the federal government declared a Tier 1 water shortage [footnote: The projected elevation is lower than 1,075 feet (equivalent to around 37 percent of full capacity)] in the Colorado River in 2021 [reference: Bureau of Reclamation. [link: https://www.usbr.gov/newsroom/news-release/3950?filterBy=year&year=2021 “Reclamation announces 2022 operating conditions for Lake Powell and Lake Mead”]. News release on August 16, 2021.]
Around 30 percent of water has been cut for central Arizona agricultural usage.[reference: [link: https://azwaternews.com/2021/08/16/arizona-heads-into-tier-1-colorado-river-shortage-for-2022/ Arizona Municipal Water Users Association]] Water supplies to cities and industries are not changed, but Scottsdale, Arizona, is asking all residents, businesses, and visitors to conserve water usage by at least 5 percent.[reference: [link: https://www.scottsdaleaz.gov/water/news/Scottsdale-asks-residents-to-use-five-percent-less-water-and-conserve-more City of Scottsdale Water News], January 11, 2022.] The federal government warns that the level of Lake Mead will continue to decline and has called for further Basin-wide conservation efforts.
Looking forward
Water is a precious resource. Amid pressures from human activities, and uncertainties linked to climate change, robust water management will be critical to the sustainable use of freshwater resources. This is especially important when considering the interdependencies that exist between water, food production, energy, ecosystems, and economic activities.
Robust water management systems cannot exist without accurate and timely monitoring. However, numerous data gaps exist. As the main source of freshwater, aquifers face situations of depletion and pollution in various regions of the world, but there is little available data about the quality and quantity of groundwater.[reference: Ravenscroft, Peter, and Lucy Lytton. 2022. [link: https://openknowledge.worldbank.org/handle/10986/37197 Seeing the Invisible : A Strategic Report on Groundwater Quality.] Washington, DC: World Bank.] Water stress information is also far from complete.[reference: FAO (Food and Agriculture Organization) and UN-Water. 2021. [link: https://www.unwater.org/sites/default/files/app/uploads/2021/08/SDG6_Indicator_Report_642_Progress-on-Level-of-Water-Stress_2021_ENGLISH_pages-1.pdf Progress on Level of Water Stress. Global status and acceleration needs for SDG Indicator 6.4.2, 2021.]]
Various initiatives are being undertaken to address this situation. The World Bank is contributing to this effort through the [link: https://www.ciwaprogram.org/data-initiatives Cooperation in International Waters in Africa], the [link: https://wbwaterdata.org/ibnet International Benchmarking Network for Water and Sanitation Utilities], and the [link: https://wbwaterdata.org/siasar Rural Water and Sanitation Information System]. The upcoming World Bank report “The Hidden Wealth of Nations : The Economics of Groundwater in Times of Climate Change” will also seek to provide additional data and a “comprehensive understanding of the importance and value of groundwater for development under evolving conditions”.
Learn more about
SDG
6
In the charts below you can find more facts about SDG {activeGoal} targets, which are not covered in this story. The data for these graphics is derived from official UN data sources.
SDG target
6.1.1
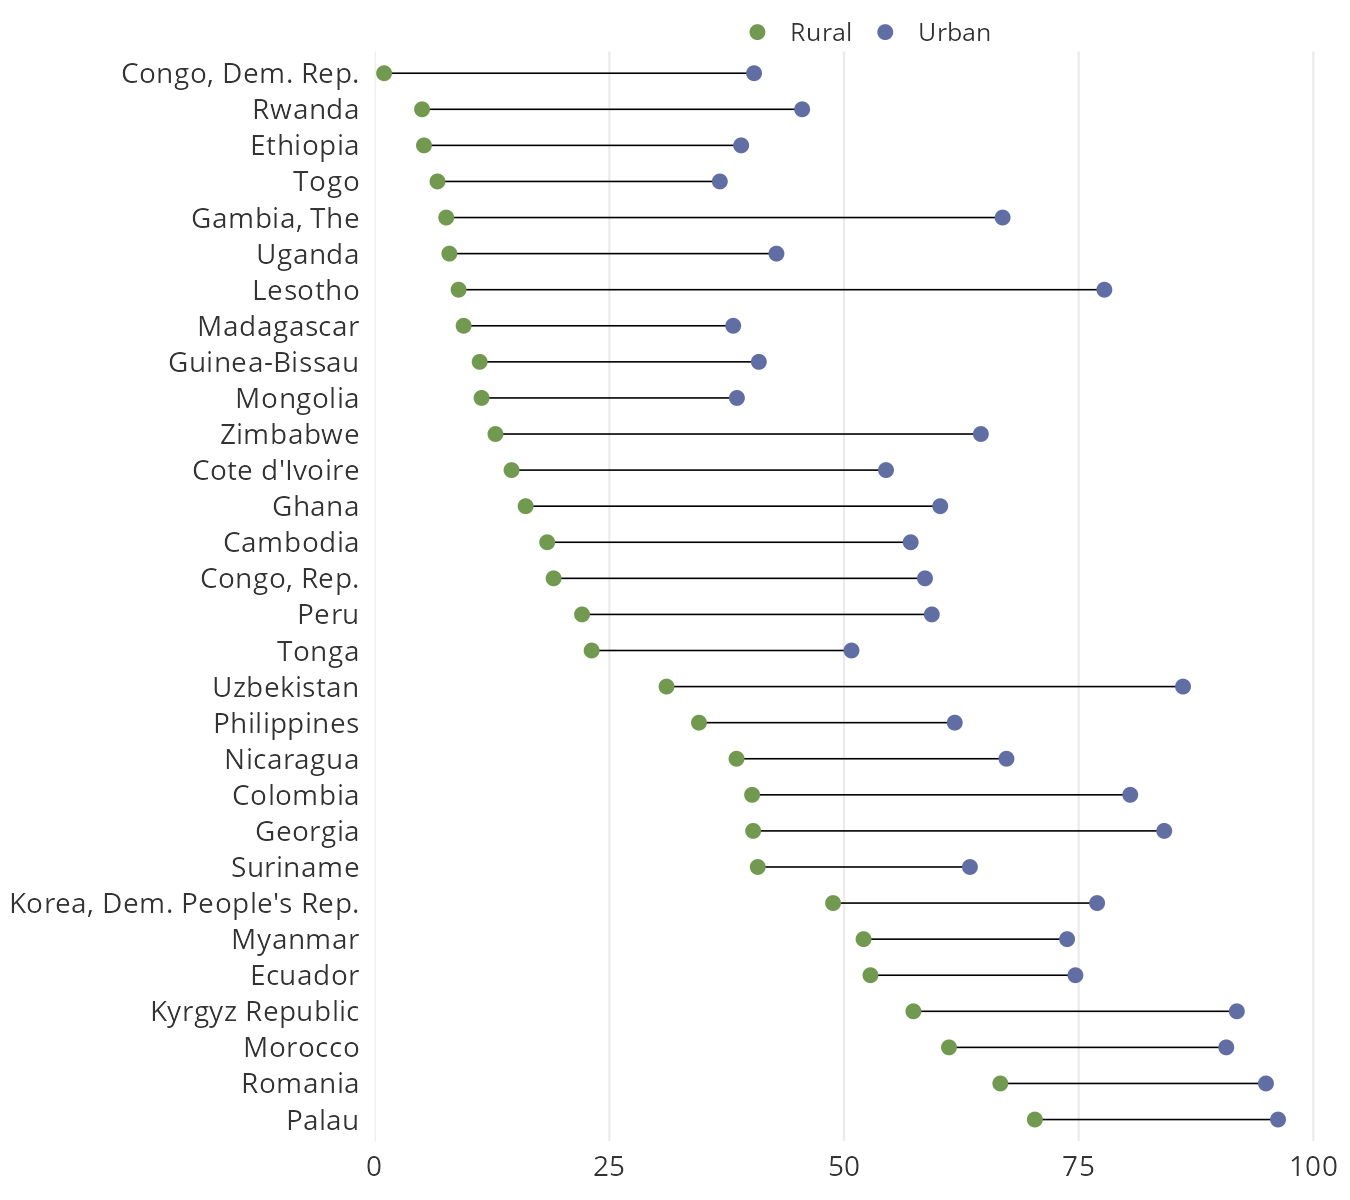
Rural dwellers are disadvantaged in access to drinking water.
Proportion of rural and urban people using safely managed drinking water services, (%), 2020
* The figure includes 30 countries with the largest gaps in access between urban and rural dwellers (out of 62 countries with data) in 2020.
Source: WHO/UNICEF JMP for Water Supply, Sanitation and Hygiene. Retrieved from World Development Indicators ([link: https://data.worldbank.org/indicator/SH.H2O.SMDW.RU.ZS SH.H2O.SMDW.RU.ZS], [link: https://data.worldbank.org/indicator/SH.H2O.SMDW.UR.ZS SH.H2O.SMDW.UR.ZS]).DOWNLOAD
SDG target
6.2.1
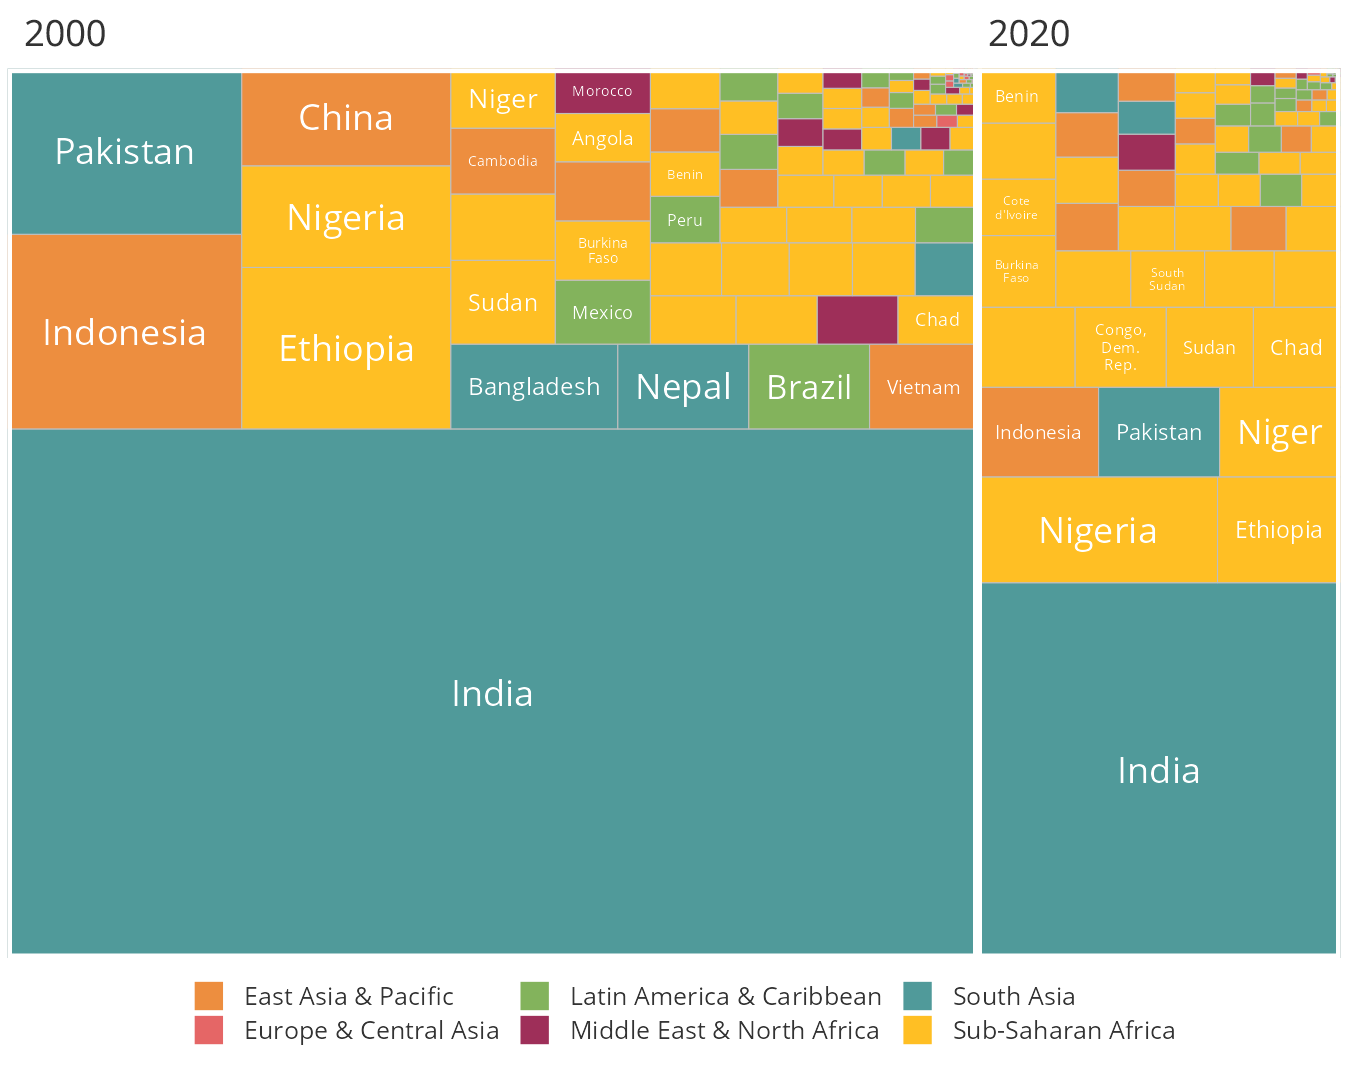
Although the number has drastically declined for the past 21 years, 494 million people in the world still defecate in the open. They are concentrated in South Asia and Sub-Saharan Africa.
Number of people practicing open defecation, 2000 and 2020
Source: WHO/UNICEF JMP for Water Supply, Sanitation and Hygiene. Retrieved from World Development Indicators ([link: https://data.worldbank.org/indicator/SH.STA.ODFC.ZS SH.STA.ODFC.ZS], [link: https://data.worldbank.org/indicator/SP.POP.TOTL SP.POP.TOTL]).DOWNLOAD