[goal: 17] calls for revitalizing the global partnership for development—which depends on greater and sustained mobilization of resources. From 2019 to 2022, official development assistance saw a sharp increase due to the COVID-19 pandemic and the war in Ukraine. However, excluding these unique events, support for the world’s poorest countries was lower than pre-pandemic levels.
Progress toward the Sustainable Development Goals requires significant investment in programs, policies, human capital, and infrastructure. Official development assistance (ODA) from foreign governments supports the development of less wealthy countries. This aid typically flows to receiving governments through bilateral flows, or through non-governmental organizations or multilaterals, including the United Nations and the World Bank. The 31 members that make up the OECD Development Assistance Committee (DAC) [footnote: A list of DAC members can be accessed [link: https://www.oecd.org/dac/development-assistance-committee/ here] are among the largest providers of this type of aid.
Aid is at an all-time high, driven by the response to the war in Ukraine and the pandemic
Funding from DAC countries has significantly increased in recent years for needs related to COVID-19 and Russia’s invasion of Ukraine. Preliminary data for 2022 indicates that ODA reached a record $211.3 billion (in constant 2021 US dollars)[reference: OECD.2023.[link: https://stats.oecd.org/Index.aspx?DataSetCode=Table1 OECD Development Assistance Committee]], an increase of nearly 28 percent since 2019 in real terms. This is one of the largest jumps observed over such a short time frame.
The surge in aid from 2019 to 2022 was driven by extraordinary spending related to the COVID-19 pandemic and the war in Ukraine. In 2021, nearly $22 billion or 11.7 percent of this funding was directed towards pandemic response, including vaccine donations. Numbers for 2020 and 2022 were about half that, but still a large part of overall ODA. In 2022, aid to Ukraine soared to $16.1 billion, from $918 million in 2021. The conflict in Ukraine also led to a tripling of spending on refugees arriving in donor countries from 2021 to 2022, totaling over $30 billion, nearly 15 percent of total ODA.
Without the pandemic assistance, in-donor-country refugee support, and direct aid to Ukraine, ODA would have declined 1.2 percent in real terms compared to pre-pandemic levels in 2019. In short: less aid has been allocated for activities not related to the pandemic and the war in Ukraine.
ODA has increased during the pandemic and war in Ukraine
Source: [link: https://stats.oecd.org/Index.aspx?DataSetCode=Table1 OECD Development Assistance Committee]
Relative to the size of donor economies, aid remains short of targets
Although official aid has reached a record high in absolute real terms, it remains modest as a percentage of donor countries’ economies. The share of gross national income (GNI) dedicated to aid in DAC donor countries has hovered around 0.3 percent for the past 50 years, and reached a 40-year high of 0.36 percent in 2022.
This is barely above half the target for developed nations to allocate at least 0.7 percent of GNI for aid to less wealthy countries, as specified in [target: 17.2]. To meet this target collectively, donor countries would have to contribute an additional $200 billion in 2022, almost doubling current aid levels. The chart below illustrates the gap to the 0.7 percent target for DAC member countries in aggregate.
The gap could grow even larger in coming years if donor economies grow without substantially boosting aid, or if the pandemic and wartime support subsides.
Despite increasing in absolute numbers, ODA remains far from the target of 0.7% of GNI
Total ODA and ODA goal of 0.7% of GNI in billions of USD
Source: [link: https://stats.oecd.org/Index.aspx?DataSetCode=Table1 OECD Development Assistance Committee]
To ensure funding for some of the poorest nations, [target: 17.2] includes an additional target stating that ODA supporting least developed countries (LDCs) [footnote: A current list of LDC can be accessed [link: https://unctad.org/topic/least-developed-countries/list here]], this includes some of the world’s poorest nations, should account for 0.15 to 0.20 percent of donor countries’ GNI. These LDC economies face severe structural impediments to sustainable development and have the greatest needs for foreign aid. In aggregate, the shortfall to reach this target is also large— $30 to $50 billion in 2021.
Although overall official development assistance has increased by a record 28 percent since 2019, aid to LDCs grew just 9 percent in real terms. Despite a year of high growth in aid, preliminary data for 2022 indicates a 0.7 percent decrease in bilateral funding for LDCs compared to 2021.
Targets for least developed countries are missed as well
Source: [link: https://stats.oecd.org/Index.aspx?DataSetCode=Table2a OECD Development Assistance Committee]
This relative decline in support for the world's poorest occurs against the backdrop of the limited progress towards the goal of ending extreme poverty; [link: https://datatopics.worldbank.org/sdgatlas/goal-1-no-poverty/ more than half a billion people, nearly seven percent of the global population, is projected to remain poor in 2030.]
Source: [link: https://stats.oecd.org/Index.aspx?DataSetCode=Table2a OECD Development Assistance Committee]
In 2022, the five largest donors in terms of total development aid were the USA, Germany, Japan, France, and the United Kingdom. Together, these countries provided $124.7 billion in assistance, which accounted for 70 percent of the total ODA that year.
Aid from various countries has fluctuated over time but the same five countries were also the largest donors in 1960. Many more donors have joined DAC since then.
Countries contribute varying amounts to Least Developed Countries (LDCs) . Overall, 2022 saw a small decline in the share provided to LDCs.
Besides just looking at the total amounts donated, we can also consider Official Development Assistance (ODA) as a portion of a country's total economy, Gross National Income (GNI).
Only five countries achieved the target of allocating ODA equivalent to 0.7 percent of Gross National Income in 2022. Germany was the only of the five largest donors reaching the target, with many other big donors ranking low on this metric. Luxembourg, Norway, Sweden and Denmark were the other countries meeting this target.
Most countries allocate less than 0.15 percent of GNI in aid to LDCs, but many are closer to reaching this target than the overall goal for development assistance.
Source: [link: https://stats.oecd.org/Index.aspx?DataSetCode=Table2a OECD Development Assistance Committee]
Tracing bilateral flows of ODA
By analyzing ODA flows between countries, we can explore which donor countries give the most aid to individual recipient countries. We can identify geographic patterns for how donor countries prioritize their support. The chord diagram below illustrates flows for all countries, organized by regions. Selecting flows within the diagram, or a country from the search field, reveals the top recipients for each donor country and the top donors for each recipient country during 2015 to 2021. [footnote: Bilateral or multilateral ODA flows were not yet available for 2022 at time of publication].
Flows of ODA
ODA flows from donors to countries, and by regions (2021)
Source: [link: https://stats.oecd.org/Index.aspx?DataSetCode=Table2a OECD Development Assistance Committee]
Social sectors, health, and education on the rise
Looking at foreign aid by sector can help us understand how much support is given to different sectors and related SDGs. The tree-map below shows how much help each sector and sub-sector has received since the start of the global goals period. For example, the large area called "Social Infrastructure & Services" includes smaller segments focused on aid for education, health, water and sanitation, and community groups (civil society), for example. The lighter colors show the highest amount of aid each sub-category received in a single year between 2015 and 2021, while the darker colors show funding in the specific year chosen on the timeline below the tree-map.
Source: [link: https://stats.oecd.org/Index.aspx?DataSetCode=Table5 OECD Development Assistance Committee]
Using categories provided by the donors, aid can be systematically classified and analyzed according to the sectors it aims to benefit.
ODA allocated for social infrastructure and services, which includes sectors such as health and education, has accounted for the largest share of bilateral aid in recent years.
With health-related spending included in this category, it experienced the most significant increase in 2021, with funding doubling since 2019. This rise is attributed to expanded support for combating COVID-19, including vaccine donations.
ODA for emergency response also saw a considerable boost in 2021, primarily addressing crises and humanitarian concerns, some of which may have been linked to the pandemic.
Support for general environmental protection represents only $5.8 billion, or 3.3 percent of overall ODA that can be allocated to sectors, even though it reached an all-time high in 2021.
Source: [link: https://stats.oecd.org/Index.aspx?DataSetCode=Table5 OECD Development Assistance Committee]
Turning up the heat on aid for climate change
The tree-map above shows that aid specifically for "General Environmental Protection" is a small part of total bilateral ODA. However, donors report that as much as one-third of the total has some focus on climate change. In 2020, development aid with climate objectives reached $44 billion, but dropped in 2021, possibly because the pandemic took priority. [footnote: Numbers for 2022 were not available at time of publication.]
Adaptation and mitigation are ways to deal with climate change.
Mitigation is about finding ways to stop climate change from getting worse. It involves reducing greenhouse gasses released into the atmosphere. This typically involves projects focused on cleaner energy sources, improving efficiency, and protecting forests that absorb carbon dioxide. Prior to 2020, mitigation received up to twice the amount of adaptation projects.
Adaptation is about finding ways to deal with the effects of worsening climate change, such as storms, drought, heatwaves, and rising sea levels. This might involve building sturdier houses, improving social safety nets to cushion environmental shocks, or planting crops that can survive in different conditions. In 2020, ODA for climate change adaptation surpassed mitigation-related aid for the first time.
ODA with climate change focus
Aid supporting adaptation and mitigation in million USD
Source: [link: https://stats.oecd.org/Index.aspx?DataSetCode=Table5 OECD Development Assistance Committee]
Increased in-donor-country refugee support
The number of refugees arriving in donor countries due to conflicts, disasters, and economic hardships has increased in recent years. Some funds allocated to assist refugees in donor countries [reference: OECD. [link: https://www.oecd.org/dac/financing-sustainable-development/development-finance-standards/refugee-costs-oda.htm In-donor refugee costs in official development assistance (ODA)]] can be classified as official aid even if they do not directly reach developing nations]. Between 2015 and 2021, around 8 percent of ODA commitments have been designated to support refugees within donor countries, with considerable fluctuations based on circumstances and geography. Two significant surges in refugee support have been observed, namely the large refugee flows to Europe in 2015-2016 and in 2022.
In 2022, a surge in support for refugees was chiefly driven by Russia’s invasion of Ukraine. The conflict led to a significant increase in the number of displaced individuals seeking asylum in neighboring and distant countries. The international community responded by ramping up refugee assistance programs, both in humanitarian relief and welcoming and supporting these displaced individuals in their countries. The proportion of funds directed towards refugee support as a share of total support saw a noticeable uptick from 4.6 percent in 2021 to 14.4 percent of ODA in 2022.
The share of official development assistance going to refugees varies across countries and time. For example, Greece, a country that has seen large influxes of refugees coming across the Mediterranean, has spent close to a quarter of ODA to support refugees domestically in recent years. Meanwhile, countries less affected by refugee arrivals, such as Japan, Luxembourg and the Republic of Korea spent very little of their aid on refugees in their countries.
Share of ODA going to refugees in donor countries
Support as percentage of total Official Development Assistance
Source: [link: https://stats.oecd.org/Index.aspx?DataSetCode=Table1 OECD Development Assistance Committee]
Many other flows to finance development
The data in this chapter on official development assistance (ODA) is incomplete. Notably, the global aid figures here are from OECD DAC and do not include significant aid flows from large emerging economies, such as China, Russia, Brazil, India, and South Africa. These countries are increasingly vital contributors, and as a result the analysis here does not show the full picture of development assistance.
ODA among other flows
Selected financial flows to developing countries 1990-2022
Source: World Bank. [link: https://www.knomad.org/ KNOMAD]
Furthermore, ODA is only one of the financial channels included in [goal: 17], "Partnerships for the Goals." Other sources, such as lending, foreign direct investment, remittances, and philanthropic donations, all contribute to financing the progress of the SDGs. The chart above illustrates how ODA, once the largest flow to developing countries in the early 1990s, has become one of the smallest in today's global financial landscape. ODA nonetheless remains an important element in strengthening government systems and providing public goods crucial for development. Official aid is often more robust during periods of economic uncertainty, but also fluctuates and can change rapidly, as seen in recent years.
Learn more about
SDG
17
In the charts below you can find more facts about SDG {activeGoal} targets, which are not covered in this story. The data for these graphics is derived from official UN data sources.
SDG target
17.3.2
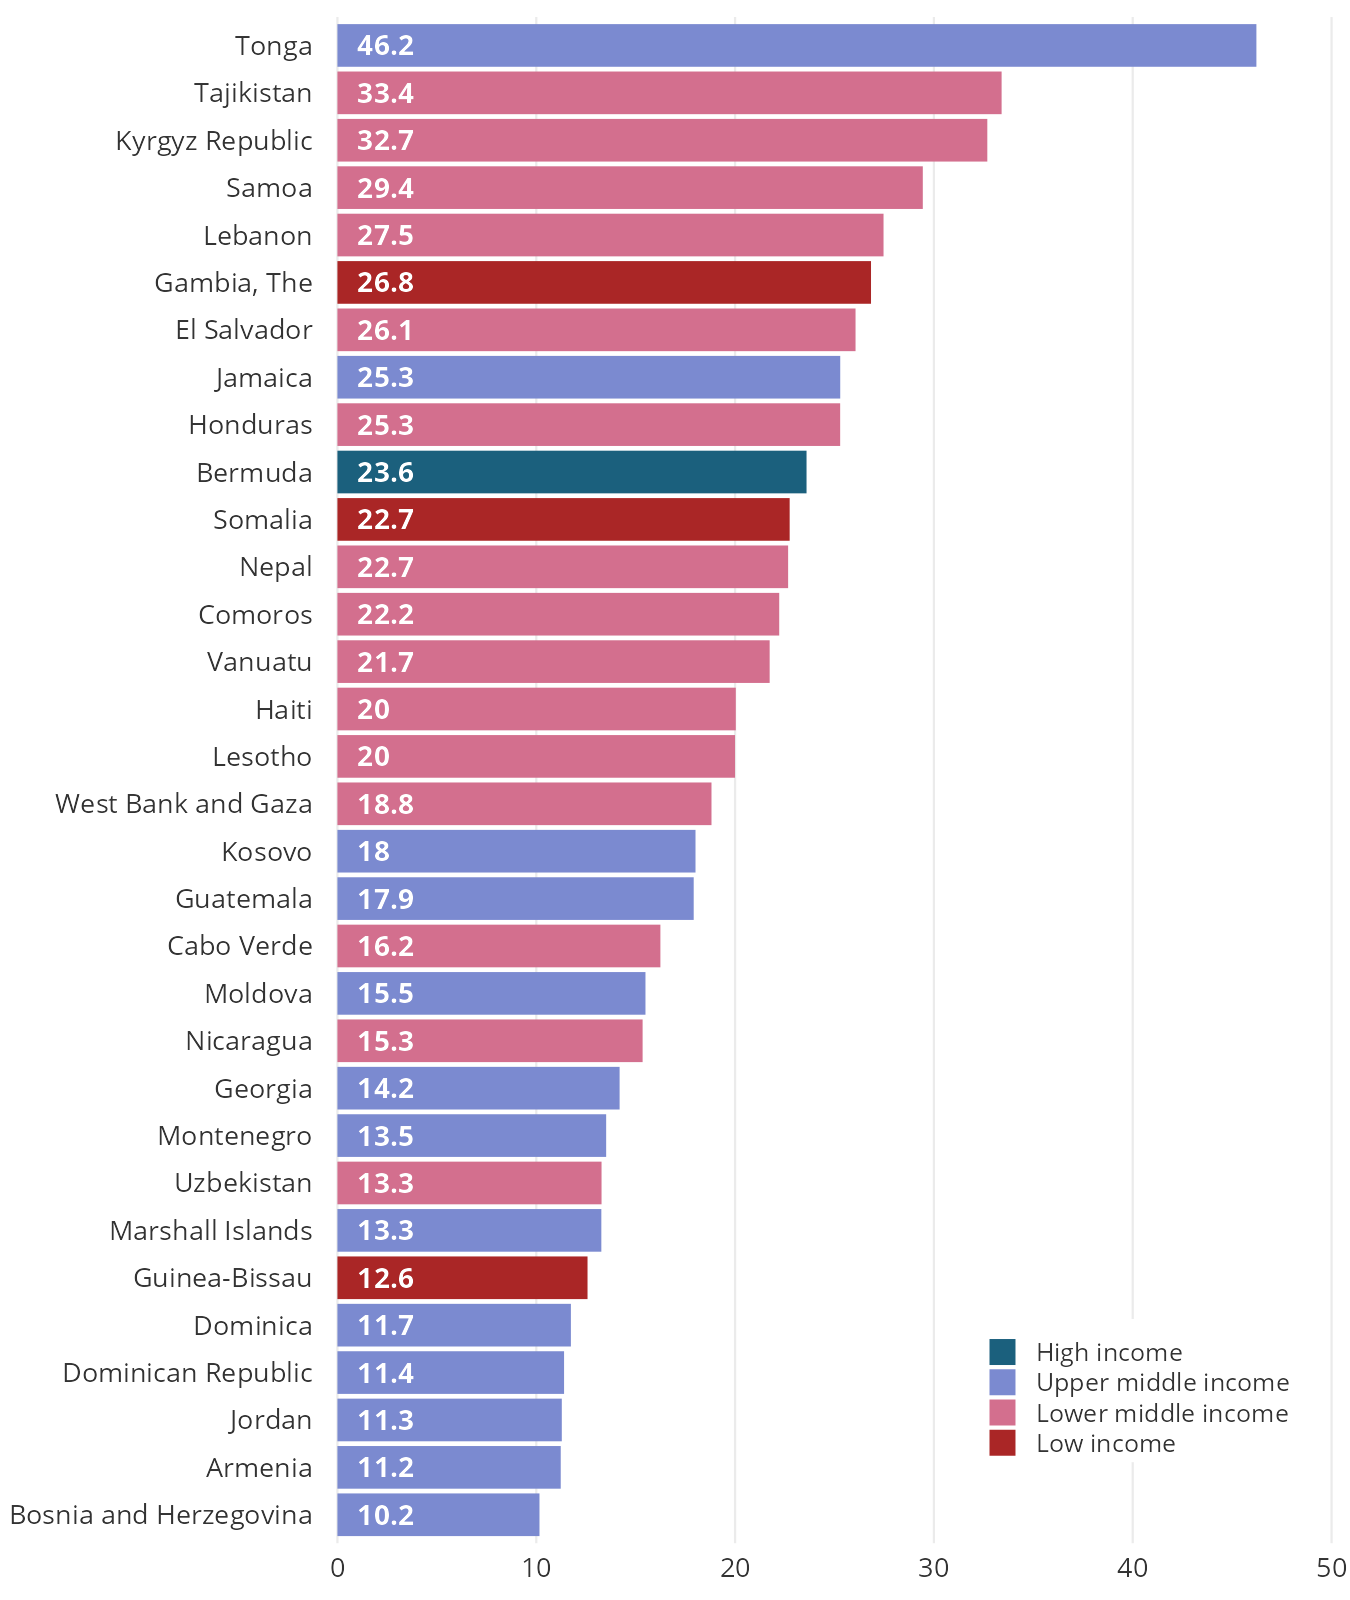
Remittances account for more than 10% of GDP in many low and middle-income countries.
Volume of remittances (in United States dollars) as a proportion of total GDP (%), 2021
* The figure only includes countries where remittances exceeded 10% of their GDP in 2021.
Source: World Bank staff estimates based on IMF balance of payments data, and World Bank and OECD GDP estimates. Retrieved from World Development indicators ([link: https://data.worldbank.org/indicator/BX.TRF.PWKR.DT.GD.ZS BX.TRF.PWKR.DT.GD.ZS]).DOWNLOAD
SDG target
17.4.1
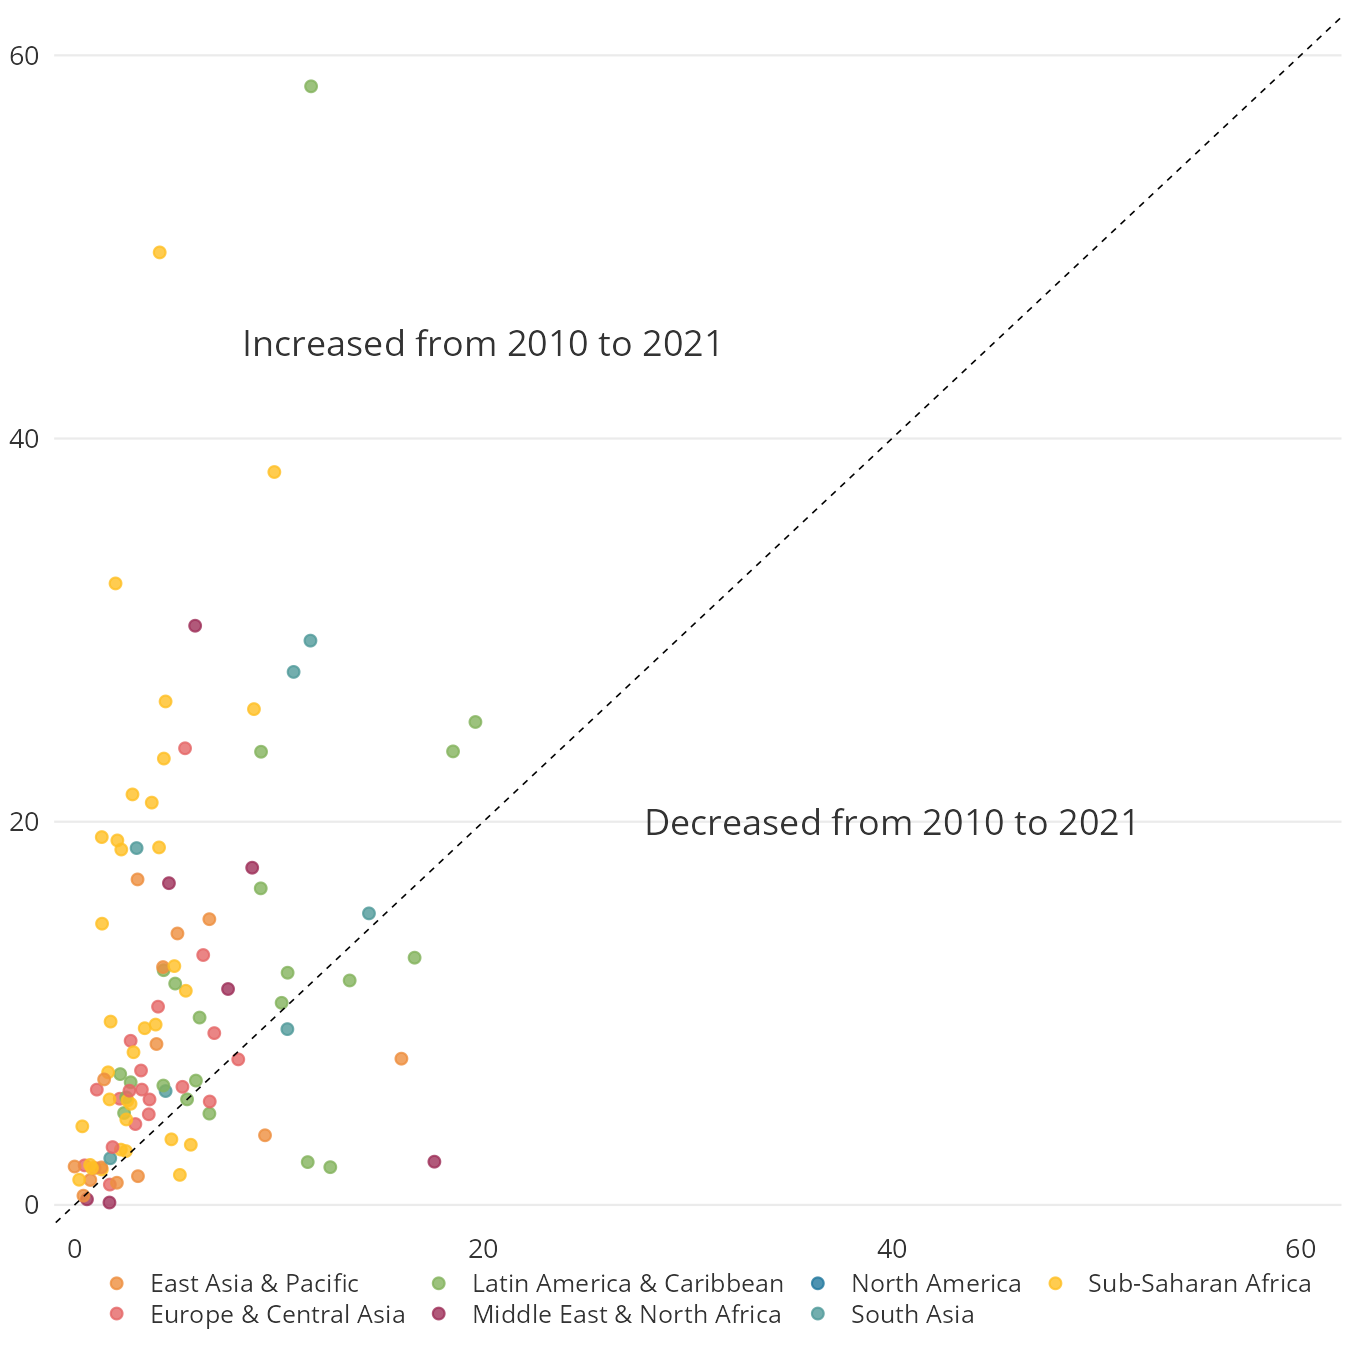
Over the last decade, debt-to-export ratio has increased across countries.
Debt service as a proportion of exports of goods and services (%) by country and region, 2010 (x-axis) and 2021 (y-axis)
* Countries above the dashed line indicate increases in debt-to-exports ratios from 2010 to 2021 while countries below the line correspond to decreases in debt-to-exports ratios during the same period.
Source: World Bank, International Debt Statistics. Retrieved from World Development indicators ([link: https://data.worldbank.org/indicator/DT.TDS.DPPF.XP.ZS DT.TDS.DPPF.XP.ZS]).DOWNLOAD
SDG target
17.8.1
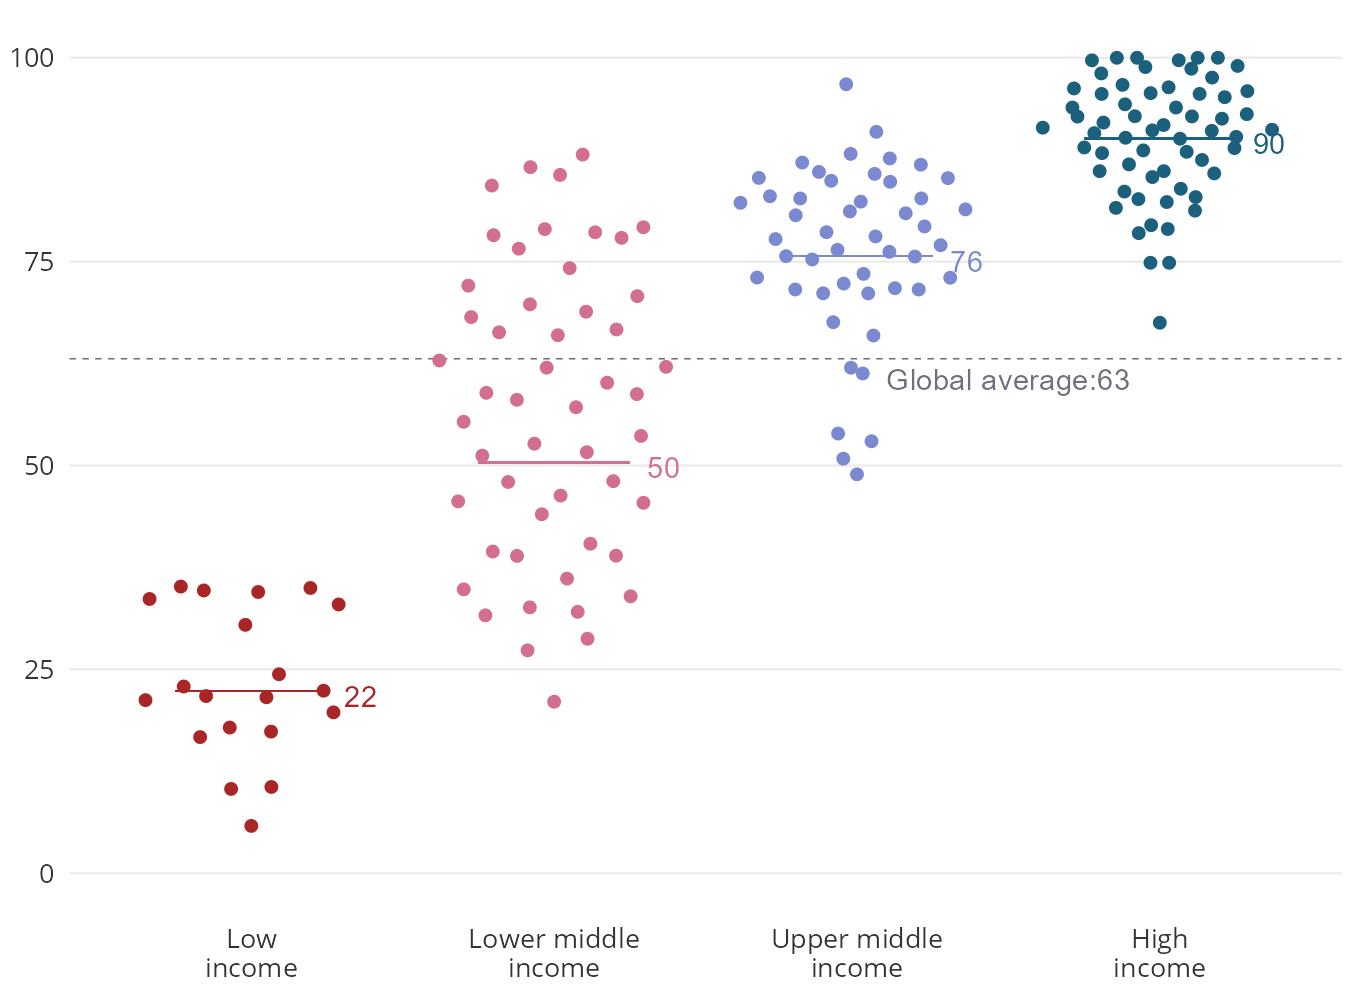
In 2021, 63% of the world’s population uses the Internet, but only 22% in low-income countries are connected online.
Individuals using the Internet by income, 2021 (% of population)
Source: International Telecommunication Union (ITU). Retrieved from World Development indicators ([link: https://data.worldbank.org/indicator/IT.NET.USER.ZS IT.NET.USER.ZS]).DOWNLOAD
SDG target
17.19.2
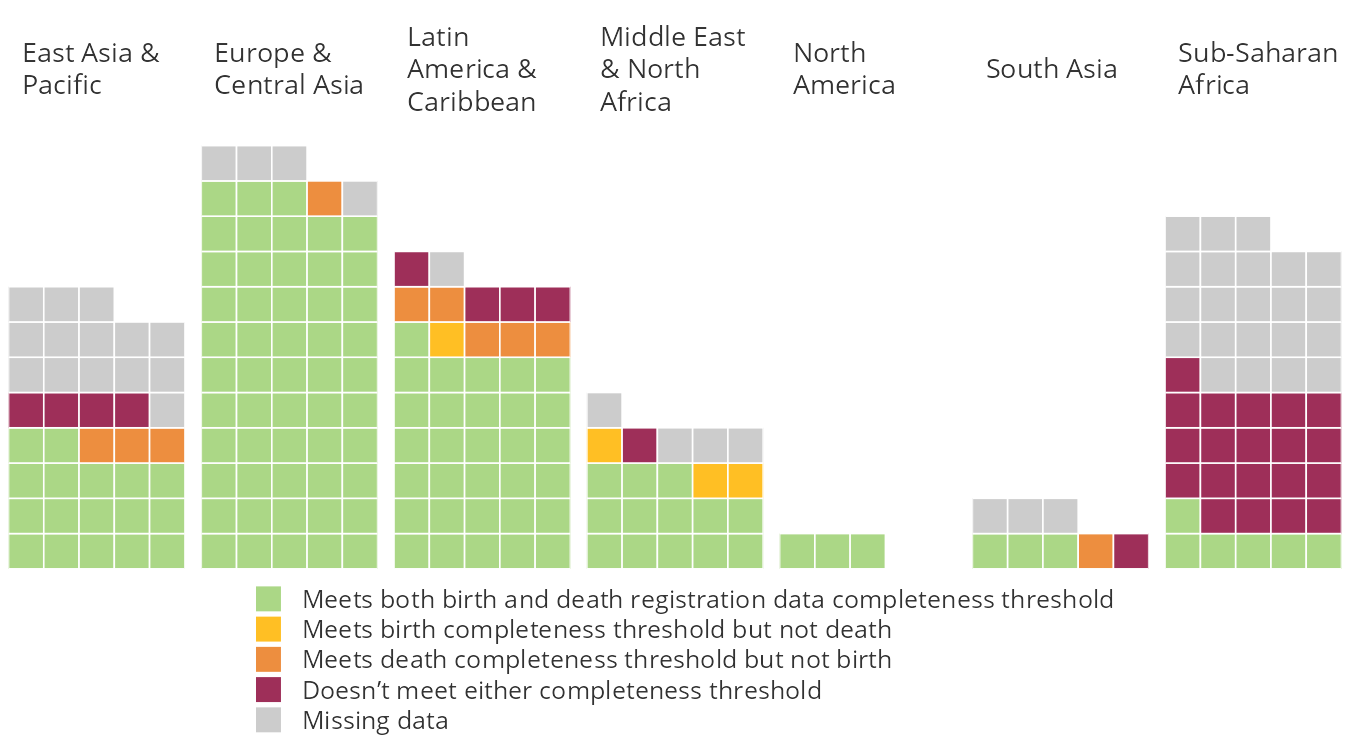
A significant number of Sub-Saharan African countries lack complete civil registration and vital statistics.
Countries with birth registration data that are at least 90 percent complete and with death registration data that are at least 75 percent complete, 2020
* each square represents a country in the respective region. Burundi, Gambia and Mozambique which do not meet birth registration completeness threshold (at least 90 percent complete) and have no data available on death registration completeness are classified as ‘Doesn’t meet either completeness threshold’.
Source: United Nations Statistics Division (UNSD). Retrieved from [link: https://unstats.un.org/sdgs/dataportal/database UN SDG Portal (17.19.2)].DOWNLOAD