Ending overfishing: An urgent need to protect our oceans
Worldwide
[goal: 14] calls for the conservation and sustainable use of the oceans. Overfishing can lead to the depletion of marine resources and can endanger the livelihoods of millions of people. In 2021, an average of 11.6 kilograms of fish per person was caught at the global level. Establishing marine protected areas can be an important tool for managing ocean resources.
[goal: 14] aims to increase efforts to conserve and sustainably use the oceans. These efforts are measured and monitored through 10 interrelated targets. [target: 14.4] is designed to regulate fishing activities and eliminate overfishing as well as illegal, unreported, unregulated, and destructive fishing. Overfishing occurs when too many fish are caught too quickly, without allowing time for the population to recover. This threatens the marine environment and the livelihoods of those who depend on it. This story also focuses on the implementation of [target: 14.5] that focuses on the establishment of marine protected areas.
Global fish production has reached an all-time high
Fish production consists of capture production, which is defined as fish caught openly in the ocean or inland waters, and aquaculture production, which consists of farmed fish.
Global fish production has expanded significantly since 1950
Source: FAO. 2023. Fishery and Aquaculture Statistics. Global production by production source 1950-2021 ([link: https://www.fao.org/fishery/en/topic/166235 FishStatJ]). In: FAO Fisheries and Aquaculture Division. Rome. Updated 2023.
In 2021, global fish production reached 182 million tonnes, with approximately equal amounts coming from capture (91.2 million tonnes) and aquaculture (90.9 million tonnes). Aquaculture has experienced rapid growth in recent decades, increasing almost sevenfold from 1990 to 2021.
Both capture and aquaculture can take place in the ocean or in inland waters (rivers and lakes). This story focuses on fish capture in the ocean.
Capture production in the ocean has remained relatively stable since the late 1990s, hovering at around 80 million tonnes per year. The 2021 capture production was more than four times the level in 1950.
In 2021, about half of capture production was sourced from the Pacific Ocean (47 million tonnes), followed by the Atlantic Ocean (19 million tonnes), and the Indian Ocean (11 million tonnes).[footnote: In addition, 11 million tonnes of capture production came from inland waters, including rivers and lakes.]
The top 10 capture producers in 2021 (China, Indonesia, Peru, Russia, United States, Vietnam, India, Japan, Norway, and Chile) represented 60 percent of the global total (excluding inland capture production).
The most captured fish species is the Peruvian anchovy, primarily used in the production of fishmeal for other animals, including farmed fish.
Source: FAO. 2023. Fishery and Aquaculture Statistics. Global production by production source 1950-2021 ([link: https://www.fao.org/fishery/en/topic/166235 FishStatJ]). In: FAO Fisheries and Aquaculture Division. Rome. Updated 2023.
Capture production is increasing pressure on wild fish stocks. In addition, aquaculture contributes to this pressure because farmed fish are often fed with captured wild fish, like the Peruvian anchovy. It can take large quantities of small wild fish to feed the larger fish in farms.[reference: Sumaila, U. Rashid, Andrea Pierruci, Muhammed A. Oyinlola, Rita Cannas, Rainer Froese, Sarah Glaser, Jennifer Jacquet, et al. 2022. [link: https://www.frontiersin.org/articles/10.3389/fmars.2022.984354/full "Aquaculture over-optimism?"] Frontiers in Marine Science 9.]
Measuring and monitoring fish resources in the ocean is more challenging than monitoring resources on land. [emphasis: Illegal, unreported, and unregulated (IUU)] fishing makes this even harder. It is estimated that one in every five fish caught comes from IUU fishing.[reference: United Nations. 2022. [link: https://www.un.org/en/observances/end-illegal-fishing-day International Day for the Fight against Illegal, Unreported and Unregulated Fishing 5 June].]
A third of the world’s capture fish stocks are overfished
In 2019, [emphasis: 35 percent] of assessed fish stocks were classified as [emphasis: overfished] by FAO,[reference: FAO. 2022. [link: https://doi.org/10.4060/cc0461en The State of World Fisheries and Aquaculture 2022. Towards Blue Transformation]. Rome.] as measured by SDG Indicator 14.4.1.[reference: FAO. [link: https://www.fao.org/sustainable-development-goals/indicators/1441/en/ Sustainable Development Goals]. Indicator 14.4.1 - Proportion of fish stocks within biologically sustainable levels.] FAO monitors assessments made by governments or regional organizations for around 600 fish subspecies populations.
The proportion of overfished stocks has reached 35 percent
Share of assessed fish stocks by sustainability level
Source: FAO. 2022. [link: https://doi.org/10.4060/cc0461en The State of World Fisheries and Aquaculture 2022. Towards Blue Transformation]. Rome.
A substantial share of fish stocks are overfished. An even larger share are maximally sustainably fished (57 percent), meaning that if capture levels were to increase they would become overfished. Some stocks remain underfished, meaning they are not in danger but this share has become very small (7 percent).
Data on the proportion of sustainable and unsustainable fish stocks (SDG Indicator 14.4.1) is available by [link: https://www.fao.org/fishery/en/area/search major fishing areas]. For example, in 2019, the Southeast Pacific and the Mediterranean and Black Sea had around two-thirds of their fish stocks within biologically unsustainable levels, much higher than the global average.
Overfishing is worse in some fishing areas
Share of assessed fish stocks that are overfished (by FAO major fishing area)
Source: FAO. 2022. [link: https://doi.org/10.4060/cc0461en The State of World Fisheries and Aquaculture 2022. Towards Blue Transformation]. Rome.
Overfishing can lead to declining fish populations, reduced fish size, and the extinction of fish species
A fish stock becomes overfished (low abundance) after experiencing high levels of capture over a period of time. This happens once its population size falls to a level below the size that may produce its [emphasis: maximum sustainable yield (MSY)], the largest amount that can be sustainably captured over the long-term.[reference: FAO. [link: https://www.fao.org/sustainable-development-goals/indicators/1441/en/ Sustainable Development Goals]. Indicator 14.4.1 - Proportion of fish stocks within biologically sustainable levels.] Data from the [link: https://www.noaa.gov/ US National Oceanic and Atmospheric Administration (NOAA)] provides a dynamic way to look at fish [emphasis: capture] and [emphasis: abundance] over time.
Source: NOAA Fisheries. 2022. Stock SMART data records. Retrieved from [link: https://apps-st.fisheries.noaa.gov/stocksmart?app=plot-stock-condition Stock SMART].
A Kobe plot presents fish stock capture and abundance relative to the levels associated with the [emphasis: maximum sustainable yield (MSY)]. Each dot on this plot represents a fish stock’s status.
A fish stock’s location on the horizontal or [emphasis: x-axis] represents its [emphasis: abundance relative to the level that can produce the MSY]. The further to the right a fish stock is, the greater its abundance. When this falls below the level that can produce the MSY (the ratio of the two is below 1), it means that a stock is [emphasis: overfished].
The fish stock’s location on the vertical or [emphasis: y-axis] represents its [emphasis: capture relative to the MSY]. The further up a fish stock is, the greater its capture. When capture is greater than the MSY (the ratio of the two is above 1), it means that a fish stock is experiencing [emphasis: overfishing].
In the plot, fish stocks fall within one of four quadrants depending on their levels of abundance and capture.
In the United States, the Pacific ocean perch represents an example of effective management as its three fish stocks (Pacific Coast, Gulf of Alaska, and Bering Sea) fall in the not overfished and currently not overfishing quadrant.
Among the different tuna fish stocks, the Pacific Bluefin is one of the most commercially valuable and also the most overfished. Its abundance is estimated to be as low as 3 percent of its original stock size.[reference: Nickson, Amanda. 2016. [link: https://www.pewtrusts.org/en/research-and-analysis/articles/2016/04/25/new-science-puts-decline-of-pacific-bluefin-at-974-percent New Science Puts Decline of Pacific Bluefin at 97.4 Percent].] The Pacific Bluefin tuna stock is located in the overfished and currently overfishing quadrant.
The plot can also visualize whether a fish stock’s status has changed over time. The last three assessments of Pacific Bluefin tuna all locate this fish stock in the overfished and currently overfishing quadrant. The 2020 assessment shows a slight increase in abundance and a slight decrease in capture compared to the 2016 and 2018 assessments.
Source: NOAA Fisheries. 2022. Stock SMART data records. Retrieved from [link: https://apps-st.fisheries.noaa.gov/stocksmart?app=plot-stock-condition Stock SMART].
Overfishing can also lead to the extinction of the large marine predators that feed on these stocks. In 2021, the IUCN released its assessment of around 1,200 species of sharks and rays concluding that the proportion of these that are threatened has increased from a quarter to a third between 2014 and 2021, most likely due to overfishing.[reference: Dulvy, Nicholas K., et al. 2021. [link: https://www.sciencedirect.com/science/article/pii/S0960982221011982 "Overfishing drives over one-third of all sharks and rays toward a global extinction crisis."] Current Biology 31 (21): 4773-4787.e8.]
More than a third of shark and ray species are threatened
Source: Dulvy, Nicholas K., et al. 2021. [link: https://www.sciencedirect.com/science/article/pii/S0960982221011982 "Overfishing drives over one-third of all sharks and rays toward a global extinction crisis."] Current Biology 31 (21): 4773-4787.e8.
Fishing-vessel technology has made it easier to catch fish
Global fishing capacity has more than doubled since 1950 and the number of fishing vessels reached 4.1 million in 2020. China has the world’s largest fishing fleet with over half a million ships.[reference: FAO. 2022. [link: https://doi.org/10.4060/cc0461en The State of World Fisheries and Aquaculture 2022. Towards Blue Transformation]. Rome.]
The size of the global fishing fleet is estimated at more than 4 million vessels
Source: Rousseau, Y., J. Blanchard, C. Novaglio, P. Kirsty, D. Tittensor, R. Watson, and Y. Ye. 2022. [link: https://doi.org/10.25959/MNGY-0Q43 Global Fishing Effort]. Institute for Marine and Antarctic Studies (IMAS). University of Tasmania (UTAS).
Technology has vastly improved fishing efficiency. Unfortunately, in some instances, these vessels’ fishing methods also allow for the capture of non-target species (sometimes referred to as [emphasis: bycatch]).[reference: FAO. [link: https://www.fao.org/3/t4890e/T4890E03.htm Part I Estimates of Global Fishery Bycatch and Discards].] Bycatch may also include endangered sharks, rays, whales, dolphins, turtles, or birds.
Reducing bycatch by fishing vessels is a challenge
Source: Tara Lambourne, Shutterstock. A turtle on deck of a fishing trawler caught as bycatch.
Shrimp trawling, for example, involves pulling a weighted net across the seafloor. This can result in the capture and discard of various fish and non-fish species in addition to shrimp.[reference: FAO. 2023. [link: https://www.fao.org/fishery/en/fishtech/1021/en Fishing Techniques. Shrimp otter trawling]. Technology Fact Sheets. Fisheries and Aquaculture Division [online]. Rome. Cited Tuesday, February 28th 2023.] A study of shrimp trawling in Northern Peru revealed that 4-6 kilograms of bycatch were caught for each kilogram of shrimp.[reference: Mendo, Jaime, et al. 2022. [link: https://doi.org/10.1371/journal.pone.0268128 "Bycatch and discards in the artisanal shrimp trawl fishery in Northern Peru."] PLOS ONE (Public Library of Science) 17 (6): 1-13.] Out of the total catch, more than 80 percent was bycatch.
Shrimp trawling may result in levels of bycatch that surpass 80 percent
Source: Mendo, Jaime, et al. 2022. [link: https://doi.org/10.1371/journal.pone.0268128 "Bycatch and discards in the artisanal shrimp trawl fishery in Northern Peru."] PLOS ONE (Public Library of Science) 17 (6): 1-13.
Bycatch may include commercial species such as perch and flounder. Even though these results refer to Northern Peru, research on artisanal shrimp trawling in other countries shows similar results. The negative impact of trawling may be partially mitigated by using new technologies such as bycatch reduction and turtle excluder devices.
Overfishing can be controlled when countries invest in and practice fisheries management (rules to prevent unsustainable fishing and to help depleted stocks rebound).[reference: Wilson, Douglas Clyde K., and Bonnie J. McCay. 2001. [link: https://www.sciencedirect.com/science/article/pii/B9780123744739004604 Fishery management, human dimension]. In Steele, J. H., editor, Encyclopedia of Ocean Sciences (Second Edition), pages 522–527. Academic Press, Oxford.] Fisheries management tools include quotas, seasonal closures, and restrictions on the size of fish that can be caught.[reference: FAO. 2021. [link: https://www.fao.org/fishery/en/topic/16200 Marine Protected Areas as a Tool for Fisheries Management (MPAs)].] However, fisheries management requires enforcement of such rules. A common method for implementing this type of regulation is the establishment of marine protected areas.
Marine protected areas (MPAs) cover 8.2 percent of coastal waters and oceans
Marine protected areas (MPAs) can be an effective conservation mechanism, especially when combined with other fisheries management tools. [target: 14.5] encourages the establishment of MPAs to cover at least [emphasis: 10 percent] of coastal waters and oceans as a strategy to conserve biodiversity, restore ocean productivity, and strengthen food security.[reference: FAO. 2022. [link: https://doi.org/10.4060/cc0461en The State of World Fisheries and Aquaculture 2022. Towards Blue Transformation]. Rome.]
Worldwide
8.2%
covered by MPAs
In 2022, about 8.2 percent of ocean waters were covered by MPAs (29.6 million km2 out of 362.5 million km2).[reference: Protected Planet. 2023. [link: https://www.protectedplanet.net/en/thematic-areas/wdpa?tab=WDPA Protected Areas (WDPA)].] This is below the [emphasis: 10 percent] target established in [target: 14.5].
National waters
18.7%
covered by MPAs
National waters, within jurisdiction of individual countries, represent almost 40 percent of the ocean.[reference: Protected Planet. 2023. [link: https://www.protectedplanet.net/en/thematic-areas/marine-protected-areas Marine Protected Areas].] The share of national waters currently protected by MPAs is 18.7 percent (26.4 million km2 out of 141.2 million km2).
International waters
1.4%
covered by MPAs
International waters, also referred to as high seas or Areas Beyond National Jurisdiction (ABNJ), comprise around 60 percent of the ocean. The share of these waters protected by MPAs is only 1.4 percent (3.2 million km2 out of 221.1 million km2).
44 countries protect more than 10 percent of their national waters
Source: UNEP-WCMC and IUCN. 2022. [link: https://www.protectedplanet.net Protected Planet:] The World Database on Protected Areas (WDPA) and World Database on Other Effective Area-based Conservation Measures (WD-OECM) [Online], November 2022, Cambridge, UK: UNEP-WCMC and IUCN.
MPAs have different names across countries (no-take zones, sanctuaries, marine parks, etc.) and the level of protection they provide varies widely. However, MPAs can be broadly defined as marine geographical areas with greater protection from human activity than surrounding waters. Their establishment helps protect marine species and habitats, and when enforced, supports the sustainability of fish stocks.
MPAs have limitations, which is why they work best when established as part of a mix of fisheries management tools.[reference: FAO. 2021. [link: https://www.fao.org/fishery/en/topic/16200 Marine Protected Areas as a Tool for Fisheries Management (MPAs)].] For example, they are unable to protect migratory species like tuna. In such cases, international cooperation may be more important than establishing geographic boundaries for conservation.[footnote: International fisheries management strategies are implemented by regional fisheries management organizations (RFMOs). For example, the [link: https://www.iattc.org/ Inter-American Tropical Tuna Commission (IATTC)] and the [link: https://www.wcpfc.int/ Western and Central Pacific Fisheries Commission (WCPFC)] bring countries together for the responsible management of tuna.]
MPA coverage is lower in international waters than in national waters
Marine Protected Areas in World Database on Protected Areas (WDPA)
Source: UNEP-WCMC and IUCN. 2022. [link: https://www.protectedplanet.net Protected Planet:] The World Database on Protected Areas (WDPA) and World Database on Other Effective Area-based Conservation Measures (WD-OECM) [Online], November 2022, Cambridge, UK: UNEP-WCMC and IUCN.
Protecting marine ecosystems from destructive fishing requires control and regulation. Marine protected areas can help control destructive activities and safeguard ocean biodiversity.[reference: Sala, Enric, Juan Mayorga, Darcy Bradley, Reniel B. Cabral, Trisha B. Atwood, Arnaud Auber, William Cheung, et al. 2021. [link: https://doi.org/10.1038/s41586-021-03371-z "Protecting the global ocean for biodiversity, food and climate."] Nature 592 (7854): 397-402.]
The world has 18,427 marine protected areas covering a surface of close to 30 million square kilometers.
Even though marine protected areas cover 8.2 percent of ocean waters, enforcement is challenging. Only 2.9 percent of the ocean is considered to be [emphasis: highly protected].[reference: Marine Conservation Institute. 2023. [link: http://mpatlas.org The Marine Protection Atlas].]
National waters represent each country’s exclusive economic zone (EEZ) [footnote: An EEZ is defined as “a zone under national jurisdiction (up to 200-nautical miles wide) declared in line with the provisions of the 1982 United Nations Convention of the Law of the Sea, within which the coastal state has the right to explore and exploit, and the responsibility to conserve and manage, the living and non-living resources” ([link: https://www.fao.org/faoterm/en/ FAO Term Portal]).] where they have the sole right to fish. Within its EEZ, a country may establish marine protected areas to protect its ecosystems. A study estimates that 90 percent of the top 10 percent priority areas for biodiversity conservation are contained within EEZs.[reference: Sala, Enric, Juan Mayorga, Darcy Bradley, Reniel B. Cabral, Trisha B. Atwood, Arnaud Auber, William Cheung, et al. 2021. [link: https://doi.org/10.1038/s41586-021-03371-z "Protecting the global ocean for biodiversity, food and climate."] Nature 592 (7854): 397-402.]
International waters, officially known as “high seas”, consist of the marine areas outside EEZs where no country has sole authority to take legal decisions.[footnote: High seas are “all parts of the sea that are not included in the exclusive economic zone, in the territorial sea or in the internal waters of a state, or in the archipelagic waters of an archipelagic state” (See [link: https://www.un.org/depts/los/convention_agreements/texts/unclos/unclos_e.pdf United Nations Convention on the Law of the Sea (UNCLOS)]).] Establishing marine protected areas in these waters is challenging due to the lack of international legal mechanisms.
In Mexico, approximately 22 percent of about 3.3 million km2 of marine and coastal areas is covered by marine protected areas.
In Australia, about 44 percent of 7.4 million km2 of marine and coastal areas is covered by marine protected areas.
The Phoenix Islands Protected Area (PIPA) is an MPA located within Kiribati’s national waters. Establishing this MPA has allowed the government of Kiribati to protect fish in the area.[footnote: It is now the world’s largest and deepest UNESCO World Heritage Site.] Moreover, turning this MPA into a no-take area in 2015 drastically reduced fishing activity to protect 400,000 km2 of habitat for species such as sharks, dolphins, and tuna, as well as corals.[reference: Oceana. 2016. [link: https://usa.oceana.org/reports/global-fishing-watch-reveals-fisheries-management-success-phoenix-islands/ Global Fishing Watch reveals a fisheries management success in the Phoenix Islands].] Fishing activity in PIPA was common before 2015, but stricter regulation led to greater protection along this tropical ecosystem of underwater volcanoes.[footnote: Recently, UNESCO expressed its concern over the lifting of regulations in PIPA. See: [link: https://whc.unesco.org/en/news/2370/ UNESCO expresses concern over the lifting of fishing no-take zones in Kiribati’s Phoenix Islands Protected Area].]
PIPA is entirely located inside Kiribati’s EEZ. In contrast, the Salas y Gómez ridge and the Nazca ridge in the southeastern Pacific are two examples of areas with rich biodiversity located in international waters. These underwater mountain chains are home to many species of sharks, rays, birds, corals, marine mammals, and turtles. Marine life in these ridges, almost entirely in international waters, is under threat from unregulated overfishing.[reference: Wagner, Daniel, Liesbeth van der Meer, Matthias Gorny, Javier Sellanes, Carlos F. Gaymer, Eulogio H. Soto, Erin E. Easton, et al. 2021. [link: https://www.sciencedirect.com/science/article/pii/S0308597X20310289 "The Salas y Gómez and Nazca ridges: A review of the importance, opportunities and challenges for protecting a global diversity hotspot on the high seas."] Marine Policy 126: 104377.]
No single country can establish an MPA along these ridges because they are mostly located in international waters (outside Chile’s and Peru’s national waters). Establishing an MPA could mitigate the impact of human activities on the rich local marine life, but requires an international agreement.
Source: UNEP-WCMC and IUCN. 2022. [link: https://www.protectedplanet.net Protected Planet:] The World Database on Protected Areas (WDPA) and World Database on Other Effective Area-based Conservation Measures (WD-OECM) [Online], November 2022, Cambridge, UK: UNEP-WCMC and IUCN.
The [link: https://www.un.org/bbnj/ United Nations General Assembly] has agreed to develop an international legally-binding instrument for the conservation and sustainable use of marine biological diversity in areas beyond national jurisdiction. In March 2023, the negotiations reached a promising agreement to protect 30 percent of the world's high seas by 2030.[footnote: See: [link: https://www.un.org/en/delegate/un-delegates-reach-historic-agreement-marine-biodiversity UN delegates reach historic agreement on marine biodiversity].]
Fish stocks are also affected by climate change
Fish stocks are experiencing the impacts of overfishing, and also of climate change (see [goal: 13]). In 2022, the [link: https://www.ipcc.ch/report/sixth-assessment-report-working-group-ii/ IPCC] released its report on climate change impacts, adaptation and vulnerability, looking particularly into ocean and coastal ecosystems. According to the report, [emphasis: acidification, warming, and deoxygenation] are all pushing marine ecosystems beyond their limits, which may lead to the collapse of regional fish stocks and aquaculture. A study estimates that the amount we can potentially fish could decline as much as 40 percent by 2050.[reference: Lam, Vicky W. Y., Edward H. Allison, Johann D. Bell, Jessica Blythe, William W. L. Cheung, Thomas L. Frölicher, Maria A. Gasalla, and U. Rashid Sumaila. 2020. [link: https://doi.org/10.1038/s43017-020-0071-9 "Climate change, tropical fisheries and prospects for sustainable development."] Nature Reviews Earth & Environment 1 (9): 440--454.]
How well fish can adapt to climate change may depend on the extent to which migratory patterns are affected.[reference: Dahlke, Flemming T., Sylke Wohlrab, Martin Butzin, and Hans-Otto Pörtner. 2020. [link: https://www.science.org/doi/abs/10.1126/science.aaz3658 "Thermal bottlenecks in the life cycle define climate vulnerability of fish."] Science 369 (6499): 65-70.] Stocks may migrate toward the poles or into deeper waters as sea temperatures rise. Some species may adapt easily while others could find it difficult to cope with changing conditions. It is possible that climate change would benefit smaller fish that can maintain high activity in warm, oxygen-poor water, with negative consequences for larger fish.[reference: Salvatteci, Renato, Ralph R. Schneider, Eric Galbraith, David Field, Thomas Blanz, Thorsten Bauersachs, Xavier Crosta, et al. 2022. [link: https://www.science.org/doi/abs/10.1126/science.abj0270 "Smaller fish species in a warm and oxygen-poor Humboldt Current system."] Science 375 (6576): 101-104.]
The livelihood of fishing communities is threatened by overfishing
Overfishing is undesirable for the fishing industry and workers in the long run. Approximately 60 million people are employed part or full-time in small-scale fisheries - about 90 percent of the total fishers’ workforce.[footnote: Small-scale fisheries can be distinguished from large-scale fisheries according to their gear, type of vessel, fishing trip duration, type of storage, number of employees, destination of catch, and area of operation.] Small-scale fisheries account for 40 percent of global catch, and represent one of the food production sectors most vulnerable to climate change.[reference: FAO, Duke University, and WorldFish. 2023. [link: https://doi.org/10.4060/cc4576en Illuminating Hidden Harvests – The contributions of small-scale fisheries to sustainable development]. Rome.] In comparison, large-scale fisheries employ 7.3 million people, about 10 percent of the workforce, and account for 60 percent of the global catch.
Large-scale fisheries account for 60 percent of the global catch from capture fisheries
Source: FAO, Duke University, and WorldFish. 2023. [link: https://doi.org/10.4060/cc4576en Illuminating Hidden Harvests – The contributions of small-scale fisheries to sustainable development]. Rome.
Small-scale fishing communities around the world are more vulnerable to the negative consequences of overfishing, pollution, habitat destruction, and climate change than large-scale fishers.[reference: Cisneros-Montemayor, Andrés M., Daniel Pauly, Lauren V. Weatherdon, and Yoshitaka Ota. 2016. [link: https://doi.org/10.1371/journal.pone.0166681 "A Global Estimate of Seafood Consumption by Coastal Indigenous Peoples."] PLOS ONE (Public Library of Science) 11 (12): 1-16.] Indigenous peoples, for example, consume more marine resources than non-indigenous populations and are highly vulnerable to changes in marine ecosystems. A study estimates that the average annual fish consumption per capita among coastal indigenous populations is 74 kg compared to a global average of 19 kg.[reference: Cisneros-Montemayor, Andrés M., Daniel Pauly, Lauren V. Weatherdon, and Yoshitaka Ota. 2016. [link: https://doi.org/10.1371/journal.pone.0166681 "A Global Estimate of Seafood Consumption by Coastal Indigenous Peoples."] PLOS ONE (Public Library of Science) 11 (12): 1-16.]
It is hard to monitor where people fish and how much they fish. One way is to track fishing vessels using [link: https://globalfishingwatch.org/our-technology/ automatic identification system (AIS) data]. Such data can provide a proxy for fishing efforts by converting the location and time spent by vessels in an area into total fishing hours per square kilometer. Small-scale fishing is more difficult to track as these vessels sometimes lack the technology to share their location.[footnote: It is possible for fishing vessels to turn off their AIS positioning systems to cover up illegal activities.]
As much as 80 percent of the fishing that occurs in international waters is by fishing vessels that carry automatic identification systems (AIS).[reference: [link: https://globalfishingwatch.org/our-technology/ Global Fishing Watch]. Our Technology.]
AIS data indicates that large fishing fleets from high-income and upper-middle-income countries account for 97 percent of trackable fishing. The analysis also reveals that these fleets are increasingly fishing in the national waters of low and lower-middle-income countries.[reference: McCauley, Douglas J., Caroline Jablonicky, Edward H. Allison, Christopher D. Golden, Francis H. Joyce, Juan Mayorga, and David Kroodsma. 2018. [link: https://www.science.org/doi/abs/10.1126/sciadv.aau2161 "Wealthy countries dominate industrial fishing."] Science Advances 4 (8): eaau2161.] Less than 3 percent of apparent fishing hours were attributed to fishing vessels from low and lower-middle-income countries.[footnote: Fishing hours are “apparent” because they are an approximation of the actual fishing hours spent by a fishing vessel. Fishing hours are not reported, but estimated by Global Fishing Watch by identifying consecutive AIS positions over a period of time in a given area.]
High and upper-middle-income countries are responsible for most trackable fishing
Trackable fishing activity by high-income countries
Source: Total apparent fishing hours for each 0.1° x 0.1° degree cell in 2021. [link: https://globalfishingwatch.org/dataset-and-code-fishing-effort/ Global Fishing Watch] vessel data was aggregated by the vessel's country of origin and then by the country's income level.
Trackable fishing activity by [emphasis: high-income countries] includes fishing carried out by the United States, Canada, Japan, South Korea, Australia, Chile, and most coastal countries in Europe.
Trackable fishing activity by [emphasis: upper-middle-income countries] is primarily carried out by China, Russia, Indonesia, Mexico, and most of the coastal countries in South America.
Among [emphasis: lower-middle-income countries], most trackable fishing is done by India, Bangladesh, Vietnam, and several coastal countries in Sub-Saharan Africa like Senegal, Ghana, Nigeria, Kenya, and Tanzania.
Trackable fishing activity by [emphasis: low-income countries] is limited. It includes countries such as Sierra Leone, Liberia, Mozambique, Madagascar, and Somalia.
Source: Total apparent fishing hours for each 0.1° x 0.1° degree cell in 2021. [link: https://globalfishingwatch.org/dataset-and-code-fishing-effort/ Global Fishing Watch] vessel data was aggregated by the vessel's country of origin and then by the country's income level.
In some cases, countries may sell fishing rights to other countries to generate revenue. For example, the [link: https://www.pnatuna.com/ Nauru Agreement] was signed by eight countries [footnote: The Federated States of Micronesia, Kiribati, the Marshall Islands, Nauru, Palau, Papua New Guinea, Solomon Islands, and Tuvalu.] in the Pacific that collectively control 25–30 percent of the world's tuna supply. Small island developing states such as these depend significantly on marine resources for food security and this agreement seeks to collectively control the fishing activities of foreign vessels in these countries' national waters.
Achieving [goal: 14] involves bringing fish stocks under effective management, increasing consumer awareness, expanding MPA coverage, and removing subsidies that may be contributing to overfishing.[reference: FAO. 2022. [link: https://www.fao.org/documents/card/en/c/cc0459en/ Blue Transformation - Roadmap 2022–2030: A vision for FAO’s work on aquatic food systems]. Rome.] Once countries develop sufficient statistical capacity to measure and track their fish stocks, management plans can be implemented to replenish overfished stocks. However, the application of scientific methods remains a major challenge in many countries where data is limited and where fish stocks remain unassessed and unmanaged.[reference: Hilborn, Ray, Ricardo Oscar Amoroso, Christopher M. Anderson, Julia K. Baum, Trevor A. Branch, Christopher Costello, Carryn L. de Moor, et al. 2020. [link: https://www.pnas.org/doi/abs/10.1073/pnas.1909726116 "Effective fisheries management instrumental in improving fish stock status."] Proceedings of the National Academy of Sciences 117 (4): 2218-2224.]
Learn more about
SDG
14
In the charts below you can find more facts about SDG {activeGoal} targets, which are not covered in this story. The data for these graphics is derived from official UN data sources.
SDG target
14.5
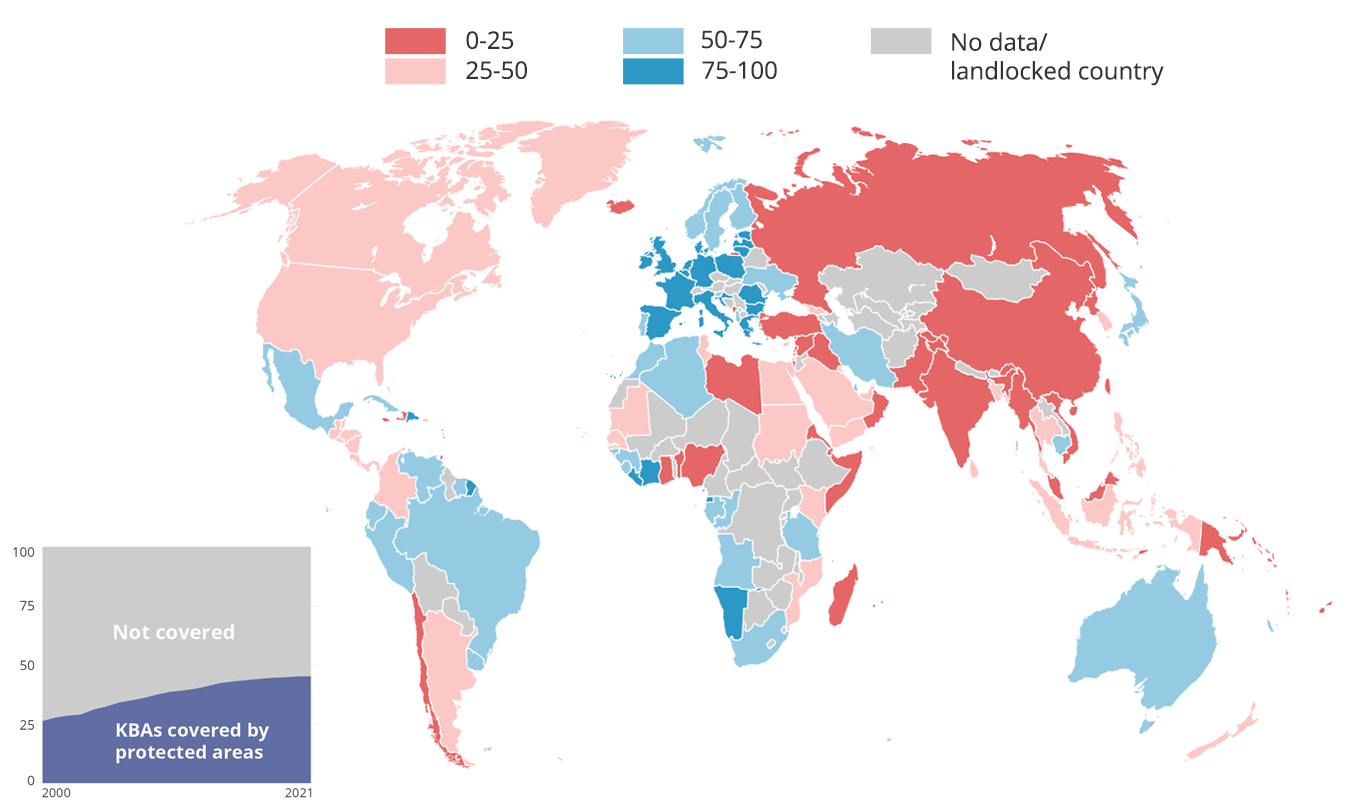
In 2021, the world’s average proportion of Marine Key Biodiversity Areas (KBAs) covered by protected areas (%) was 45 percent, but coverage varies widely among countries.
Average proportion of Marine Key Biodiversity Areas (KBAs) covered by protected areas by country, 2021 (map) and world level, 2000-2021 (bottom left)
* Key biodiversity areas meet certain criteria regarding threatened biodiversity, geographically restricted biodiversity, ecological integrity, biological processes, and irreplaceability.
Source: [link: https://unstats.un.org/sdgs/dataportal/SDMXMetadataPage?14.5.1-ER_MRN_MPA Global SDG Indicators Database]. United Nations Statistics Division (UNSD).DOWNLOAD
SDG target
14.6
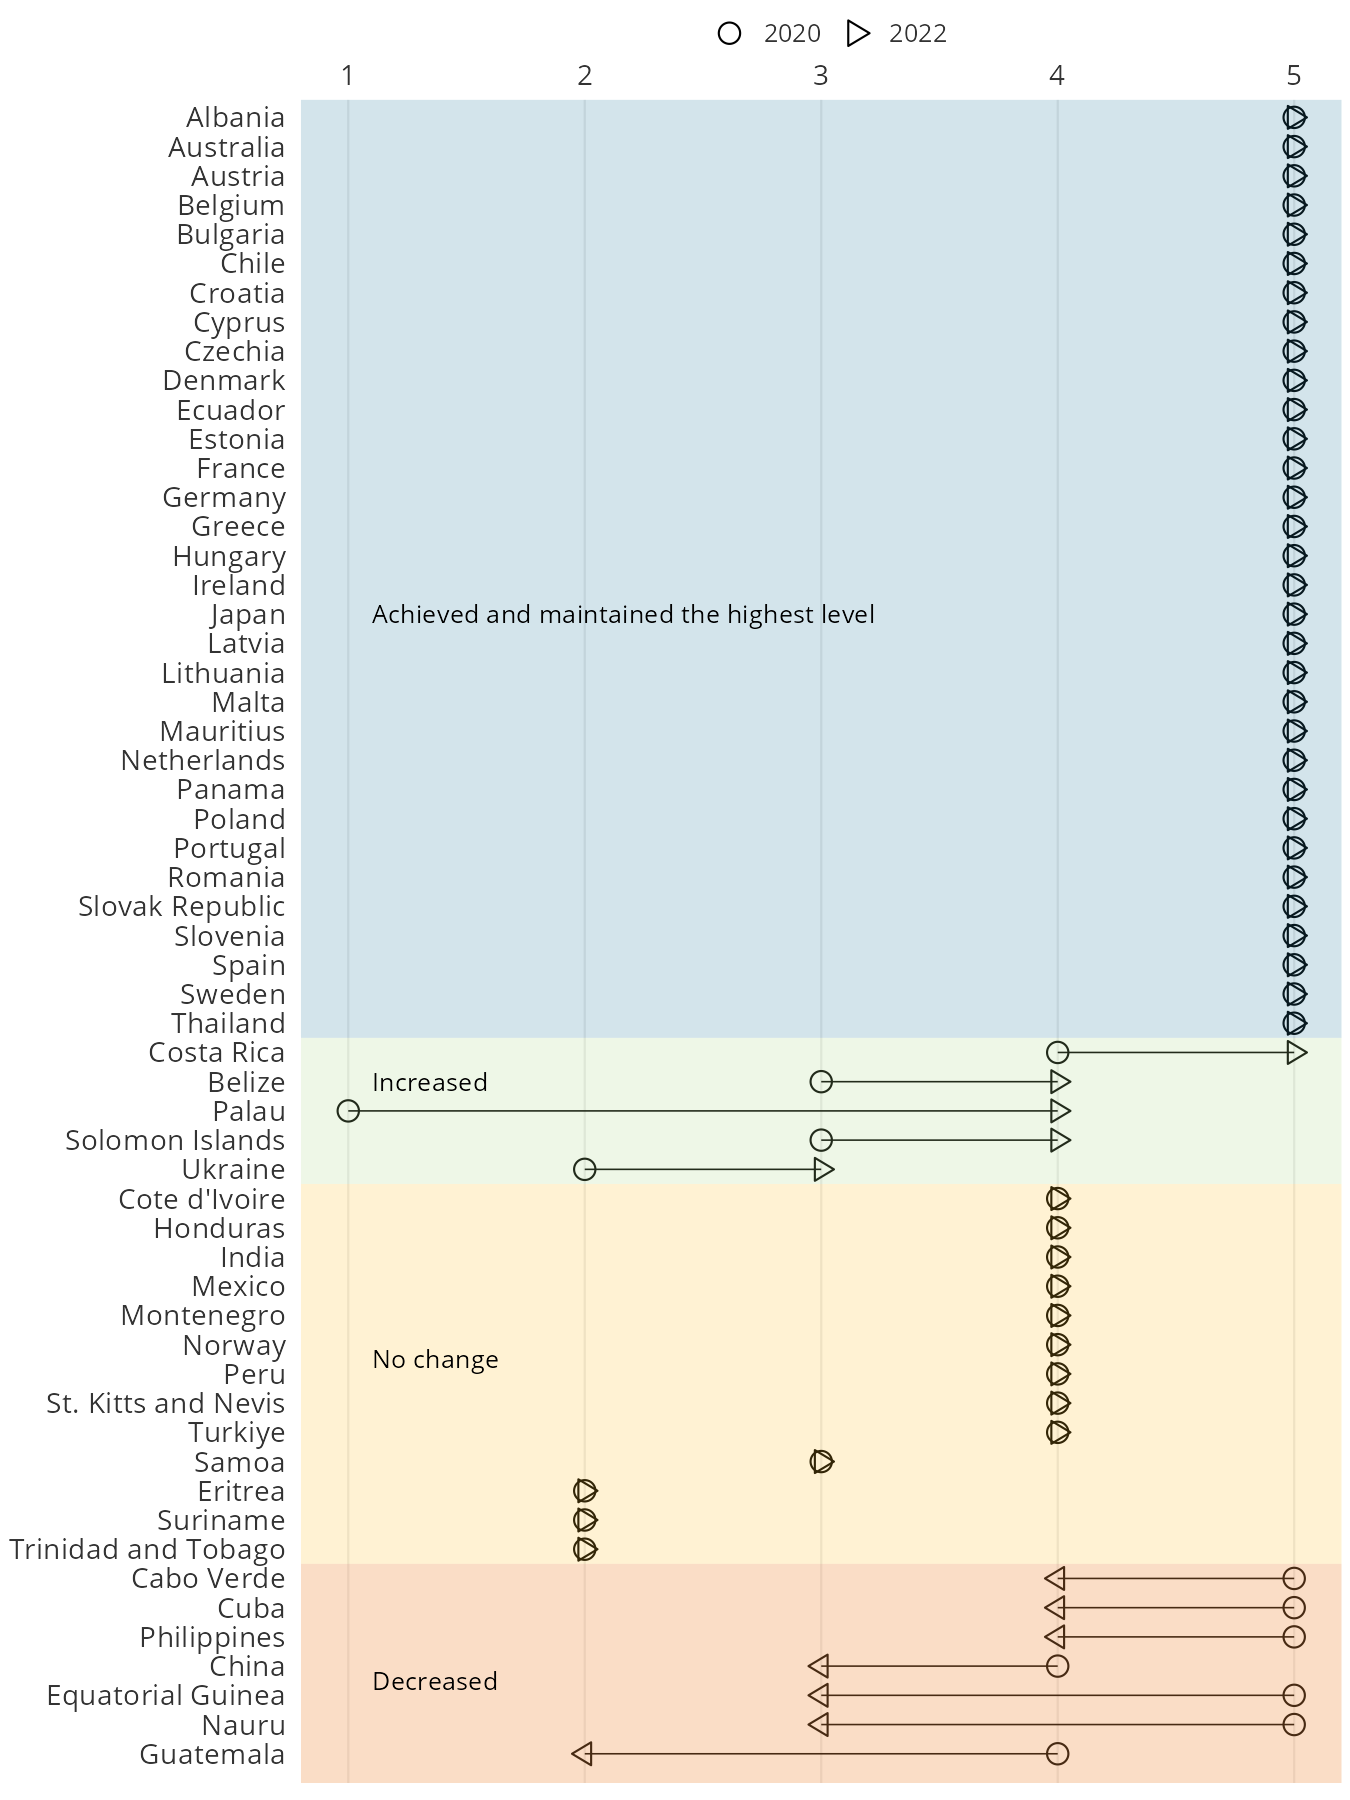
Many countries have taken important steps to combat illegal, unreported and unregulated fishing, but more concerted efforts are needed.
Progress by countries in the degree of implementation of international instruments aiming to combat illegal, unreported and unregulated fishing (level of implementation: 1 lowest to 5 highest), 2020-2022
* This chart only includes countries with reported data for 2020 and 2022. For a list of instruments please see metadata for indicator 14.6.1 in the UN SDG database.
Source: [link: https://unstats.un.org/sdgs/dataportal/SDMXMetadataPage?14.6.1-ER_REG_UNFCIM Global SDG Indicators Database]. United Nations Statistics Division (UNSD).DOWNLOAD