[goal: 9] calls for building resilient infrastructure, promoting inclusive and sustainable industrialization, and fostering innovation. Globally, 1 billion people live at least 2 kilometers away from a good road, facing reduced access to healthcare, education, and jobs. But transportation is also a rising contributor to climate change. Road transport accounted for an average of 706 kilograms of CO2 emissions per person in 2020.
Transportation is essential for ensuring access to better economic, health and education opportunities. One of the targets of [goal: 9] is to expand the availability of reliable infrastructure, including transport, that can support human and economic development. [target: 9.1]
Transportation (by road, air, sea) is also a major source of greenhouse gas emissions and hence a contributor to climate change. The transportation sector accounts for a quarter of global CO2 emissions. Countries face the challenge of expanding access to transport so that it is sustainable and clean.
Transport is essential for human development
Many people in low-income countries, particularly in rural areas, do not have access to roads or reliable transportation. One way to determine the level of access to reliable infrastructure [target: 9.1], is the Rural Access Index (RAI) (SDG indicator 9.1.1), which measures the share of the rural population in a specific country or region living within 2 km of an all-season road. Globally, an estimated one billion people lack such access, representing one in eight people in the world.[reference: World Bank. [link: https://www.worldbank.org/en/topic/transport/overview#:~:text=Transport%20is%20fundamental%20to%20supporting,benefits%20are%20not%20being%20realized. Transport Overview].]
In Sub-Saharan Africa, where almost 60 percent of the population lives outside urban areas, RAI scores can range from 17 percent of the rural population in Zambia (2011) to 56 percent in Kenya (2009). [footnote: In Sub-Saharan Africa, RAI scores are currently available for 17 countries.]
Source: World Bank, [link: https://documents1.worldbank.org/curated/en/622561619416816205/pdf/Roads-to-Schools-and-Healthcare-Facilities-Identifying-Accessibility-Gaps-in-Burkina-Faso.pdf Roads To Schools and Healthcare Facilities: Identifying Accessibility Gaps in Burkina Faso.] World Bank. 2021. [link: https://datacatalog.worldbank.org/int/search/dataset/0038250/Rural-Access-Index--RAI- Rural Access Index Database.]
Rural Access Index values are generally lower in African countries than in other regions. [footnote: The map shows the latest available numbers for the Rural Access Index.]
In Burkina Faso, the RAI is low (23.8 in 2020), which means that only about one in four people in rural areas have access to a road that can be used year-round.[reference: Stokenberga, Aiga Diallo,Cheick Omar Tidiane Lompo,Boubakar Kane,Soukeyna Menendez,Aurelio Kante,Cheick Fantamady Fam,Maimouna Mbow. 2021. [link: https://documents1.worldbank.org/curated/en/622561619416816205/pdf/Roads-to-Schools-and-Healthcare-Facilities-Identifying-Accessibility-Gaps-in-Burkina-Faso.pdf Roads to Schools and Healthcare Facilities: Identifying Accessibility Gaps in Burkina Faso” (English)] Transport Global Practice Washington, DC: World Bank Group.] This makes it challenging for rural dwellers to access education, health facilities, economic opportunities and jobs.
The blue circles in this map represent the health facilities in Burkina Faso, including medical centers and local health facilities.
In parts of the country, [footnote: The provinces of Houet, Comoe, and Soum.] over 80 percent of inhabitants need to travel more than one hour to reach a health facility. This includes some 12 million people who are more than four hours by car from a medical facility. People report using a motorcycle (39 percent), a bicycle (36 percent), a borrowed vehicle (11 percent), or walking (13 percent) for these trips. There are also significant gender disparities. About 70 percent of women [footnote: Between 15 and 50 years] need to bike or walk to reach a health facility, compared with 40 percent of men.[footnote: Men usually use a motorcycle][reference: Stokenberga, Aiga Diallo,Cheick Omar Tidiane Lompo,Boubakar Kane,Soukeyna Menendez,Aurelio Kante,Cheick Fantamady Fam,Maimouna Mbow. 2021. [link: https://documents1.worldbank.org/curated/en/622561619416816205/pdf/Roads-to-Schools-and-Healthcare-Facilities-Identifying-Accessibility-Gaps-in-Burkina-Faso.pdf Roads to Schools and Healthcare Facilities: Identifying Accessibility Gaps in Burkina Faso” (English)]
Source: World Bank, [link: https://documents1.worldbank.org/curated/en/622561619416816205/pdf/Roads-to-Schools-and-Healthcare-Facilities-Identifying-Accessibility-Gaps-in-Burkina-Faso.pdf Roads To Schools and Healthcare Facilities: Identifying Accessibility Gaps in Burkina Faso.] World Bank. 2021. [link: https://datacatalog.worldbank.org/int/search/dataset/0038250/Rural-Access-Index--RAI- Rural Access Index Database.]
Road access is strongly correlated with health and education attainment measures such as maternal mortality, literacy, and primary school completion. [reference: Stokenberga,Aiga Diallo,Cheick Omar Tidiane Lompo,Boubakar Kane,Soukeyna Menendez,Aurelio Kante,Cheick Fantamady Fam,Maimouna Mbow. 2021. [link: https://documents1.worldbank.org/curated/en/622561619416816205/pdf/Roads-to-Schools-and-Healthcare-Facilities-Identifying-Accessibility-Gaps-in-Burkina-Faso.pdf Roads to Schools and Healthcare Facilities: Identifying Accessibility Gaps in Burkina Faso” (English)]. Transport Global Practice Washington, DC: World Bank Group.]
In surveys carried out in Burkina Faso (2020), as many as two-thirds of respondents from the rural regions Boucle du Mouhoun and Centre-Est reported the availability of transport as being the most important or one of the most important constraints in accessing healthcare.
Burkina Faso transport gaps limit healthcare access
Relative importance of transport-related constraints for accessing healthcare services (% of respondents), Burkina Faso
Source: World Bank. 2021. [link: https://documents1.worldbank.org/curated/en/622561619416816205/pdf/Roads-to-Schools-and-Healthcare-Facilities-Identifying-Accessibility-Gaps-in-Burkina-Faso.pdf Roads To Schools and Healthcare Facilities: Identifying Accessibility Gaps in Burkina Faso.] Data collected by a study team in December 2020 in Boucle du Mouhoun and Centre-Est.
Reducing travel time to schools could improve educational outcomes. A higher Rural Access Index, with lower travel times to education facilities, is associated with higher school enrollment and completion rates and lower dropout rates in Burkina Faso. [reference: Stokenberga,Aiga Diallo,Cheick OmarTidiane Lompo,Boubakar Kane,Soukeyna Menendez,Aurelio Kante,Cheick Fantamady Fam,Maimouna Mbow. 2021. [link: https://documents1.worldbank.org/curated/en/622561619416816205/pdf/Roads-to-Schools-and-Healthcare-Facilities-Identifying-Accessibility-Gaps-in-Burkina-Faso.pdf Roads to Schools and Healthcare Facilities: Identifying Accessibility Gaps in Burkina Faso” (English)] Transport Global Practice Washington, DC: World Bank Group.] For example, completion rates for post-primary schools increase by more than 3.3 percentage points for each 10 minute reduction in travel time to school.
Better school access is associated with higher enrollment and completion in Burkina Faso
Percentage-point change given a 10-minute reduction in average motorized travel time to the nearest school
Source: World Bank. 2021. [link: https://documents1.worldbank.org/curated/en/622561619416816205/pdf/Roads-to-Schools-and-Healthcare-Facilities-Identifying-Accessibility-Gaps-in-Burkina-Faso.pdf Roads To Schools and Healthcare Facilities: Identifying Accessibility Gaps in Burkina Faso], Author's estimates based on accessibility study conducted in this study and Ministry of Education data (2019/20)]
People in poor and remote rural areas need access to healthcare, education, and jobs. However, it is equally important that all forms of transportation worldwide reduce greenhouse gas emissions that contribute to climate change.
Transport is a large contributor to emissions and climate change
While essential for human development, decarbonizing the transport sector is critical for tackling climate change.
Of total CO2 emissions
25%
come from transport
Transport accounts for a quarter of global CO2 emissions [reference: IEA. [link: https://www.iea.org/data-and-statistics/data-tools/greenhouse-gas-emissions-from-energy-data-explorer Greenhouse Gas Emissions from Energy Data Explorer]] and about 16 percent of total greenhouse gas emissions.[reference: IEA. [link: https://www.iea.org/reports/electric-vehicles Electric Vehicles]]
If transportation networks grow and rely on fossil fuels, transport emissions will increase by almost 60 percent by 2050. [reference: Benitez, Daniel Alberto, and Jyoti Bisbey. 2021. [link: https://openknowledge.worldbank.org/entities/publication/e9bafdd7-91ab-5e8a-811e-7a207fb75a3b Financing Low Carbon Transport Solutions in Developing Countries.] Transport Decarbonization Investment Series. World Bank, Washington, DC.]
Transport accounts for 25% of global CO2 emissions
CO2 emissions from fuel combustion by sector, Gigatons
Note: In this visual electricity and heat have been reallocated to final sectors.DataImageCopy Link
Source: International Energy Agency (IEA). [link: https://www.iea.org/data-and-statistics/data-tools/greenhouse-gas-emissions-from-energy-data-explorer Greenhouse Gas Emissions from Energy Data Explorer].
Road transport accounts for 75 percent of the transportation sector’s global CO2 emissions, followed by shipping and aviation.
Road transport contributes most of the transport sector’s CO2 emissions
Global CO2 emissions from transport by sub-sector (2021)
Source: International Energy Agency (IEA).[link: https://www.iea.org/data-and-statistics/charts/global-co2-emissions-from-transport-by-sub-sector-in-the-net-zero-scenario-2000-2030 Global CO2 emissions from transport by sub-sector in the Net Zero Scenario, 2000-2030, IEA, Paris, Licence: CC BY 4.0.]
In 2020, COVID-19 led to significant declines in global transportation volume. The drop in aviation traffic was the most dramatic ever recorded. Worldwide, airlines carried 1.8 billion passengers in 2020, a decrease of 60 percent compared with 4.6 billion passengers in 2019. The number of plane departures decreased by 40 percent and air freight declined by 18 percent that same year. Aviation began to recover in 2021.
The number of air passengers decreased by 60% in 2020
Source: The International Civil Aviation Organization (ICAO). Retrieved from World Development Indicators ([link: https://data.worldbank.org/indicator/IS.AIR.PSGR IS.AIR.PSGR], [link: https://data.worldbank.org/indicator/IS.AIR.DPRT IS.AIR.DPRT], [link: https://data.worldbank.org/indicator/IS.AIR.GOOD.MT.K1 IS.AIR.GOOD.MT.K1])
City-level, real-time traffic data can provide insight into travel patterns during the pandemic. Once COVID-19 was officially declared a worldwide pandemic, many countries implemented stay-at-home orders or recommendations which led to an immediate decline in the number of cars on the road. Lockdowns were implemented starting in March 2020 in cities around the world including New York, Bogota, Mumbai, and Manila. Waze data [footnote: Waze, owned by Google, is the world’s largest community-based traffic and navigation app, through which drivers contribute to a global database of real-time traffic and road info.] for these cities [footnote: Data includes traffic alerts, irregularities, and jams.] shows a pronounced decrease in traffic volume immediately following the introduction of the lockdowns.
Road traffic declined in many cities in the first weeks of the pandemic
Weekly Waze traffic alerts: New York, Bogota, Mumbai, Manila (2019-2021)
Note: Waze alerts include traffic alerts, irregularities, and jams.ImageCopy Link
Source: Waze
Multiple studies documented the drop in pollutant levels in early 2020, when movement was limited due to the pandemic, compared to the same period in 2019. In particular, levels of nitrogen dioxide (NO2), one of the most potent greenhouse gasses, declined in this period. One study, using measurements from 34 countries, found reductions of approximately 60 percent in levels of NO2 and 30 percent in particulate matter (PM2.5) at the ground level. [footnote: Air pollution measurements used satellite data as well as data from more than 10,000 air quality ground stations gathered in 2020 between 1 January and 15 May, and compared with a 3-year average for the same dates. To aggregate the information at the country level the study used population-weighted means based on the population density within 10 km of each station.] [reference: Venter ZS, Aunan K, Chowdhury S, Lelieveld J. 2020. [link: https://pubmed.ncbi.nlm.nih.gov/32723816/ COVID-19 lockdowns cause global air pollution declines]. Proc Natl Acad Sci U S A. 2020 Aug 11;117(32):18984-18990] The primary source of NO2 in the atmosphere is road transportation (vehicles including cars, buses, trucks). Exposure to NO2 can lead to the development of asthma and may make people more vulnerable to respiratory infections. [reference: United States Environmental Protection Agency (EPA). [link: https://www.epa.gov/no2-pollution Nitrogen Dioxide (NO2) Pollution]]
Traffic declines during COVID-19 lockdowns were correlated with lower levels of air pollution
Lockdown ground-level air pollution anomalies relative to weather benchmarks for nitrogen dioxide (NO2) and fine particulate matter (PM2.5)
Source: Venter ZS, Aunan K, Chowdhury S, Lelieveld J. 2020. [link: https://pubmed.ncbi.nlm.nih.gov/32723816/ COVID-19 lockdowns cause global air pollution declines.] Proc Natl Acad Sci U S A. 2020 Aug 11;117(32):18984-18990.
Another study measuring pollutant levels across the same 34 countries found that approximately 50,000 deaths and 90,000 pediatric asthma emergency room visits were avoided from mid-March to mid-May of 2020 as a result of reductions in air pollution.[reference: Z.S. Venter, K. Aunan, S. Chowdhury, J. Lelieveld. 2021. [link: https://pubmed.ncbi.nlm.nih.gov/33152273/ Air pollution declines during COVID-19 lockdowns mitigate the global health burden], Environ Res, 192 (2021), Article 110403] These findings indicate that curbing transport pollution can have a large beneficial impact on public health.
In 2020, global CO2 emissions from transport experienced the largest drop in two decades. As activity and all types of transport bounced back in 2021, so did growth in emissions.
Transportation rebounded in 2021 as did emissions from transport
Source: International Energy Agency (IEA).[link: https://www.iea.org/data-and-statistics/charts/global-co2-emissions-from-transport-by-sub-sector-in-the-net-zero-scenario-2000-2030 Global CO2 emissions from transport by sub-sector in the Net Zero Scenario, 2000-2030, IEA, Paris, Licence: CC BY 4.0]
Historically, high-income countries have been the largest sources of greenhouse gases from transportation, with emissions per capita five times higher than those in lower-income countries. [reference: Benitez, Daniel Alberto, and Jyoti Bisbey. 2021. [link: https://openknowledge.worldbank.org/entities/publication/e9bafdd7-91ab-5e8a-811e-7a207fb75a3b Financing Low Carbon Transport Solutions in Developing Countries.] Transport Decarbonization Investment Series. World Bank, Washington, DC.] Countries like Luxembourg, Qatar, and the United States have the highest levels. In Luxembourg, 2020 transport emissions per capita were over 336 times higher than in the Democratic Republic of Congo.
Per capita emissions from road transport are much higher in high-income countries
Road CO2 emissions from fuel combustion, per capita (2020)
Source: IEA.2022. All rights reserved. [link: https://www.iea.org/data-and-statistics/data-product/greenhouse-gas-emissions-from-energy-highlights Greenhouse Gas Emissions from Energy Highlights]
However, cumulatively, total transport emissions in low- and middle-income countries are on track to reach and surpass those from high-income economies due to faster growth over the past 20 years.
Transport emissions in low- and middle-income countries are increasing rapidly
Source: [link: https://www.climatewatchdata.org/ghg-emissions?end_year=2019&start_year=1990 ClimateWatch]. Historical GHG Emissions. 2022. Washington, DC: World Resources Institute.
Demand for transportation is growing in lower-income countries
Over the next few decades, cities in Sub-Saharan Africa and in South Asia are expected to see sharp population growth. By 2030, an estimated five billion people in the world will live in urban areas. [reference: United Nations Population Fund. [link: https://www.unfpa.org/urbanization Urbanization].]
The expansion in urban populations accompanied by growth in incomes will likely lead to a large increase in motor vehicle ownership in non-OECD countries. [reference: World Bank. 2021. [link: https://openknowledge.worldbank.org/entities/publication/c3ff3d2b-f8e7-57a9-8183-b5573a4b86fb Motorization Management and the Trade of Used Vehicles: How Collective Action and Investment Can Help Decarbonize the Global Transport Sector.] World Bank, Washington, DC.] In non-OECD countries, the ownership rate for conventional vehicles is projected to nearly double between 2020 and 2050 and will surpass the rate in OECD countries in a few years.
Car ownership in lower-income countries will continue to grow
Conventional vehicles (light-duty, gasoline, and diesel internal combustion engine vehicles)
Source: U.S. Energy Information Administration. [link: https://www.eia.gov/outlooks/ieo/ International Energy Outlook 2021].
The increase in car ownership and use is attributable in part to inadequate public transportation. In many cities in lower-income economies, urban planning focuses more on helping private drivers than public transport. This results in congestion which affects public transport the most, as larger vehicles are less agile in traffic. [footnote: Intense competition among public transit firms also incentivizes bus companies to purchase older, more polluting vehicles to keep costs low.] As a result of public transportation shortcomings, people often turn to private cars and taxis (including ride-hailing services) that are highly inefficient in terms of emissions. [reference: Ardila-Gomez, Arturo; Bianchi Alves, Bianca; Moody, Joanna. 2021. [link: https://openknowledge.worldbank.org/entities/publication/cbca1a6e-7273-5d86-abae-feb471b77dc3 Decarbonizing Cities by Improving Public Transport and Managing Land Use and Traffic.] Transport Decarbonization Investment Series. World Bank, Washington, DC.] This undermines the achievement of [target: 9.4] of increasing infrastructure sustainability.
Taxis, private cars, and low occupancy vehicles are generally more polluting than public transportation.
Benchmark for carbon emissions in urban transport
CO2 emissions from energy consumption during vehicle use (g CO2/passenger-km)
Source: Ardila-Gomez, Arturo; Bianchi Alves, Bianca; Moody, Joanna. 2021. [link: https://openknowledge.worldbank.org/entities/publication/cbca1a6e-7273-5d86-abae-feb471b77dc3 Decarbonizing Cities by Improving Public Transport and Managing Land Use and Traffic.] Transport Decarbonization Investment Series. World Bank, Washington, DC.
Used vehicles raise environmental and safety challenges
Many older cars have inadequate emission and safety standards, especially if not properly maintained. [reference: World Bank. 2021. [link: https://openknowledge.worldbank.org/entities/publication/c3ff3d2b-f8e7-57a9-8183-b5573a4b86fb Motorization Management and the Trade of Used Vehicles : How Collective Action and Investment Can Help Decarbonize the Global Transport Sector.] World Bank, Washington, DC.] Although the highest per capita transport emissions come from rich economies they also have been seeing improved performance and efficiency with the adoption of new technologies. Meanwhile, used vehicles that no longer meet newer emission standards are often exported. This contributes to increasing local air pollution and road accidents in lower-income countries, as well as to rising global greenhouse emissions.[reference: Benitez, Daniel Alberto, and Jyoti Bisbey. 2021. [link: https://openknowledge.worldbank.org/entities/publication/e9bafdd7-91ab-5e8a-811e-7a207fb75a3b Financing Low Carbon Transport Solutions in Developing Countries.] Transport Decarbonization Investment Series. World Bank, Washington, DC.]
The European Union, Japan, the United States, and South Korea are the world’s largest exporters of used vehicles: combined they exported almost 24 million light-duty vehicles [footnote: Light Duty Vehicles include passenger cars, SUVs, and pickup trucks.] between 2015 and 2020. [footnote: According to data compiled by the United Nations Environment Programme (UNEP)] Almost 13 million of these were exported to low- and middle-income countries, with Sub-Saharan Africa importing over 4.3 million.[reference: UNEP. 2020. [link: https://www.unep.org/resources/report/used-vehicles-and-environment-progress-and-updates-2021 Used Vehicles and the Environment report]]
Many used vehicles are exported from high-income to lower-income economies
Used vehicle flows to low and lower middle income countries (total, 2015 - 2020)
Data on used vehicle trade shows only the first country to which the cars are exported from these destinations (US, EU, Japan, and South Korea). However, the same cars may be re-exported. For example, many used cars imported into the United Arab Emirates from the EU are resold to countries in Sub-Saharan Africa, increasing the number of used vehicles flowing into the region. And although some countries, such as South Africa, ban the import of used vehicles for local use, these can be imported and then resold in other jurisdictions. For example, in 2018, South Africa imported approximately 79,000 used vehicles destined for other countries in Sub-Saharan Africa.[reference: UNEP. 2020. [link: https://www.unep.org/resources/report/used-vehicles-and-environment-progress-and-updates-2021 Used Vehicles and the Environment report].]
Often there is insufficient regulation for used vehicles in the importing countries. Many jurisdictions in Sub-Saharan Africa, Central America, and other regions allow the import of cars more than 10 years old or place no age limits on imported vehicles.
Some countries impose no age limits for imported used cars
Used light duty vehicle import age limits
Note: Based on data collected from the 146 countries studied as of July 2020. Updated with information for member countries of the Economic Community of West African States ([link: https://www.unep.org/news-and-stories/story/west-african-ministers-adopt-cleaner-fuels-and-vehicles-standards?_ga=2.181975783.1735161305.1647909019-719247943.1647909019 UNEP]).DataImageCopy Link
Source: [link: https://www.unep.org/resources/report/used-vehicles-and-environment-progress-and-updates-2021 UNEP. 2020. Used Vehicles and the Environment Report.]
In high- and upper-middle income countries, vehicles in circulation must comply with emissions standards to limit atmospheric pollutants. The standard currently in use in European and other high-income economies is Euro 6 (currently the most stringent emissions standard) or equivalent [reference: Australian Government. [link: https://www.infrastructure.gov.au/sites/default/files/migrated/vehicles/environment/forum/files/light-vehicle-emission-standards-for-cleaner-air.pdf Light Vehicle Emission Standards for Cleaner Air]] . However, many lower-income countries have no standard or inadequate emission rules for both imported and new, locally produced vehicles. Moving to higher emissions standards for cars is also dependent on the quality of fuel available. [reference: UNEP. 2020. [link: https://www.unep.org/resources/report/used-vehicles-and-environment-progress-and-updates-2021 Used Vehicles and the Environment report].]
Many lower-income economies lack adequate emission standards
Used light duty vehicle import emission standards
Note: Based on data collected from the 146 countries studied as of July 2020. Updated with information for member countries of the Economic Community of West African States ([link: https://www.unep.org/news-and-stories/story/west-african-ministers-adopt-cleaner-fuels-and-vehicles-standards?_ga=2.181975783.1735161305.1647909019-719247943.1647909019 UNEP]).DataImageCopy Link
Source: [link: https://www.unep.org/resources/report/used-vehicles-and-environment-progress-and-updates-2021 UNEP 2020 Used Vehicles and the Environment Report]
Nevertheless, progress is being made. As of 2021, 15 Sub-Saharan countries of the Economic Community of West African States have adopted the Euro 4 vehicle emissions standard. [reference: UNEP. [link: https://www.unep.org/news-and-stories/story/west-african-ministers-adopt-cleaner-fuels-and-vehicles-standards?_ga=2.181975783.1735161305.1647909019-719247943.1647909019 West African Ministers adopt cleaner fuels and vehicles standards].] On average, Euro 4 vehicles are less fuel-intensive, emitting fewer CO2 emissions than cars produced under previous standards. A car using Euro 4 can emit up to 16 percent less CO2 than one using no standards.[reference: World Bank. 2021. [link: https://openknowledge.worldbank.org/entities/publication/c3ff3d2b-f8e7-57a9-8183-b5573a4b86fb Motorization Management and the Trade of Used Vehicles: How Collective Action and Investment Can Help Decarbonize the Global Transport Sector.] World Bank, Washington, DC.] The Euro 4 standard also requires better safety features.
Making transport sustainable is essential for containing climate change
As global mobility needs increase, it is imperative that current and future transportation needs are met in a way that significantly reduces the carbon footprint of the transport sector. Key to this goal will be the widespread adoption of stringent emission standards for vehicles worldwide, urban and territorial planning that favors public transport, cycling, and walking, as well as the adoption of new technologies. [reference: Benitez, Daniel Alberto, and Jyoti Bisbey. 2021. [link: https://openknowledge.worldbank.org/entities/publication/e9bafdd7-91ab-5e8a-811e-7a207fb75a3b Financing Low Carbon Transport Solutions in Developing Countries.] Transport Decarbonization Investment Series. World Bank, Washington, DC.]
The electrification of transportation can play a key role in reducing emissions and tackling climate change. When widely adopted and charged using power from renewable sources, electric vehicles can significantly contribute to decarbonization. A fleet of electric vehicles (EVs) can reduce greenhouse gas emissions by approximately 50 percent compared with a similar fleet of conventional vehicles, according to IEA estimates. [reference: Alam, Muneeza Mehmood, and Yoomin Lee. 2021. [link: https://openknowledge.worldbank.org/entities/publication/86a88ec0-cccc-55d2-8e09-19134518b00f Cleaner Vehicles and Charging Infrastructure: Greening Passenger
The market for personal electric vehicles has grown over the past decade but this has taken place almost exclusively in high-income countries (United States and Europe) and in China. The main obstacles for rapid market expansion for EVs are the cost of electric cars and the availability of charging infrastructure.
Electric vehicles are being sold primarily in high income countries and in China
Sales of electric vehicles by income group (2010 - 2020)
Source: Alam, Muneeza Mehmood, and Yoomin Lee. 2021. [link: https://openknowledge.worldbank.org/entities/publication/86a88ec0-cccc-55d2-8e09-19134518b00f Cleaner Vehicles and Charging Infrastructure: Greening Passenger Fleets for Sustainable Mobility. Transport Decarbonization Investment Series.] World Bank, Washington, DC.
The electrification of transport will require an all-of-society approach, including the improvement of the technical, financial, and regulatory institutional capacity of countries, and the integration of renewable energy sources into the grid. [reference: Alam, Muneeza Mehmood, and Yoomin Lee. 2021. [link: https://openknowledge.worldbank.org/entities/publication/86a88ec0-cccc-55d2-8e09-19134518b00f Cleaner Vehicles and Charging Infrastructure: Greening Passenger
Accelerating the transition to cleaner transport and thereby improving air quality in many populated urban areas will require funding support, particularly for low-income countries, including many in Sub-Saharan Africa. In the coming years, in addition to government policies, climate investing needs to become an important tool to support the transition to low-carbon transport, which will have global implications for addressing climate change.[reference: Benitez, Daniel Alberto, and Jyoti Bisbey. 2021. [link: https://openknowledge.worldbank.org/entities/publication/e9bafdd7-91ab-5e8a-811e-7a207fb75a3b Financing Low Carbon Transport Solutions in Developing Countries.] Transport Decarbonization Investment Series. World Bank, Washington, DC.]
Learn more about
SDG
9
In the charts below you can find more facts about SDG {activeGoal} targets, which are not covered in this story. The data for these graphics is derived from official UN data sources.
SDG target
9.3.2
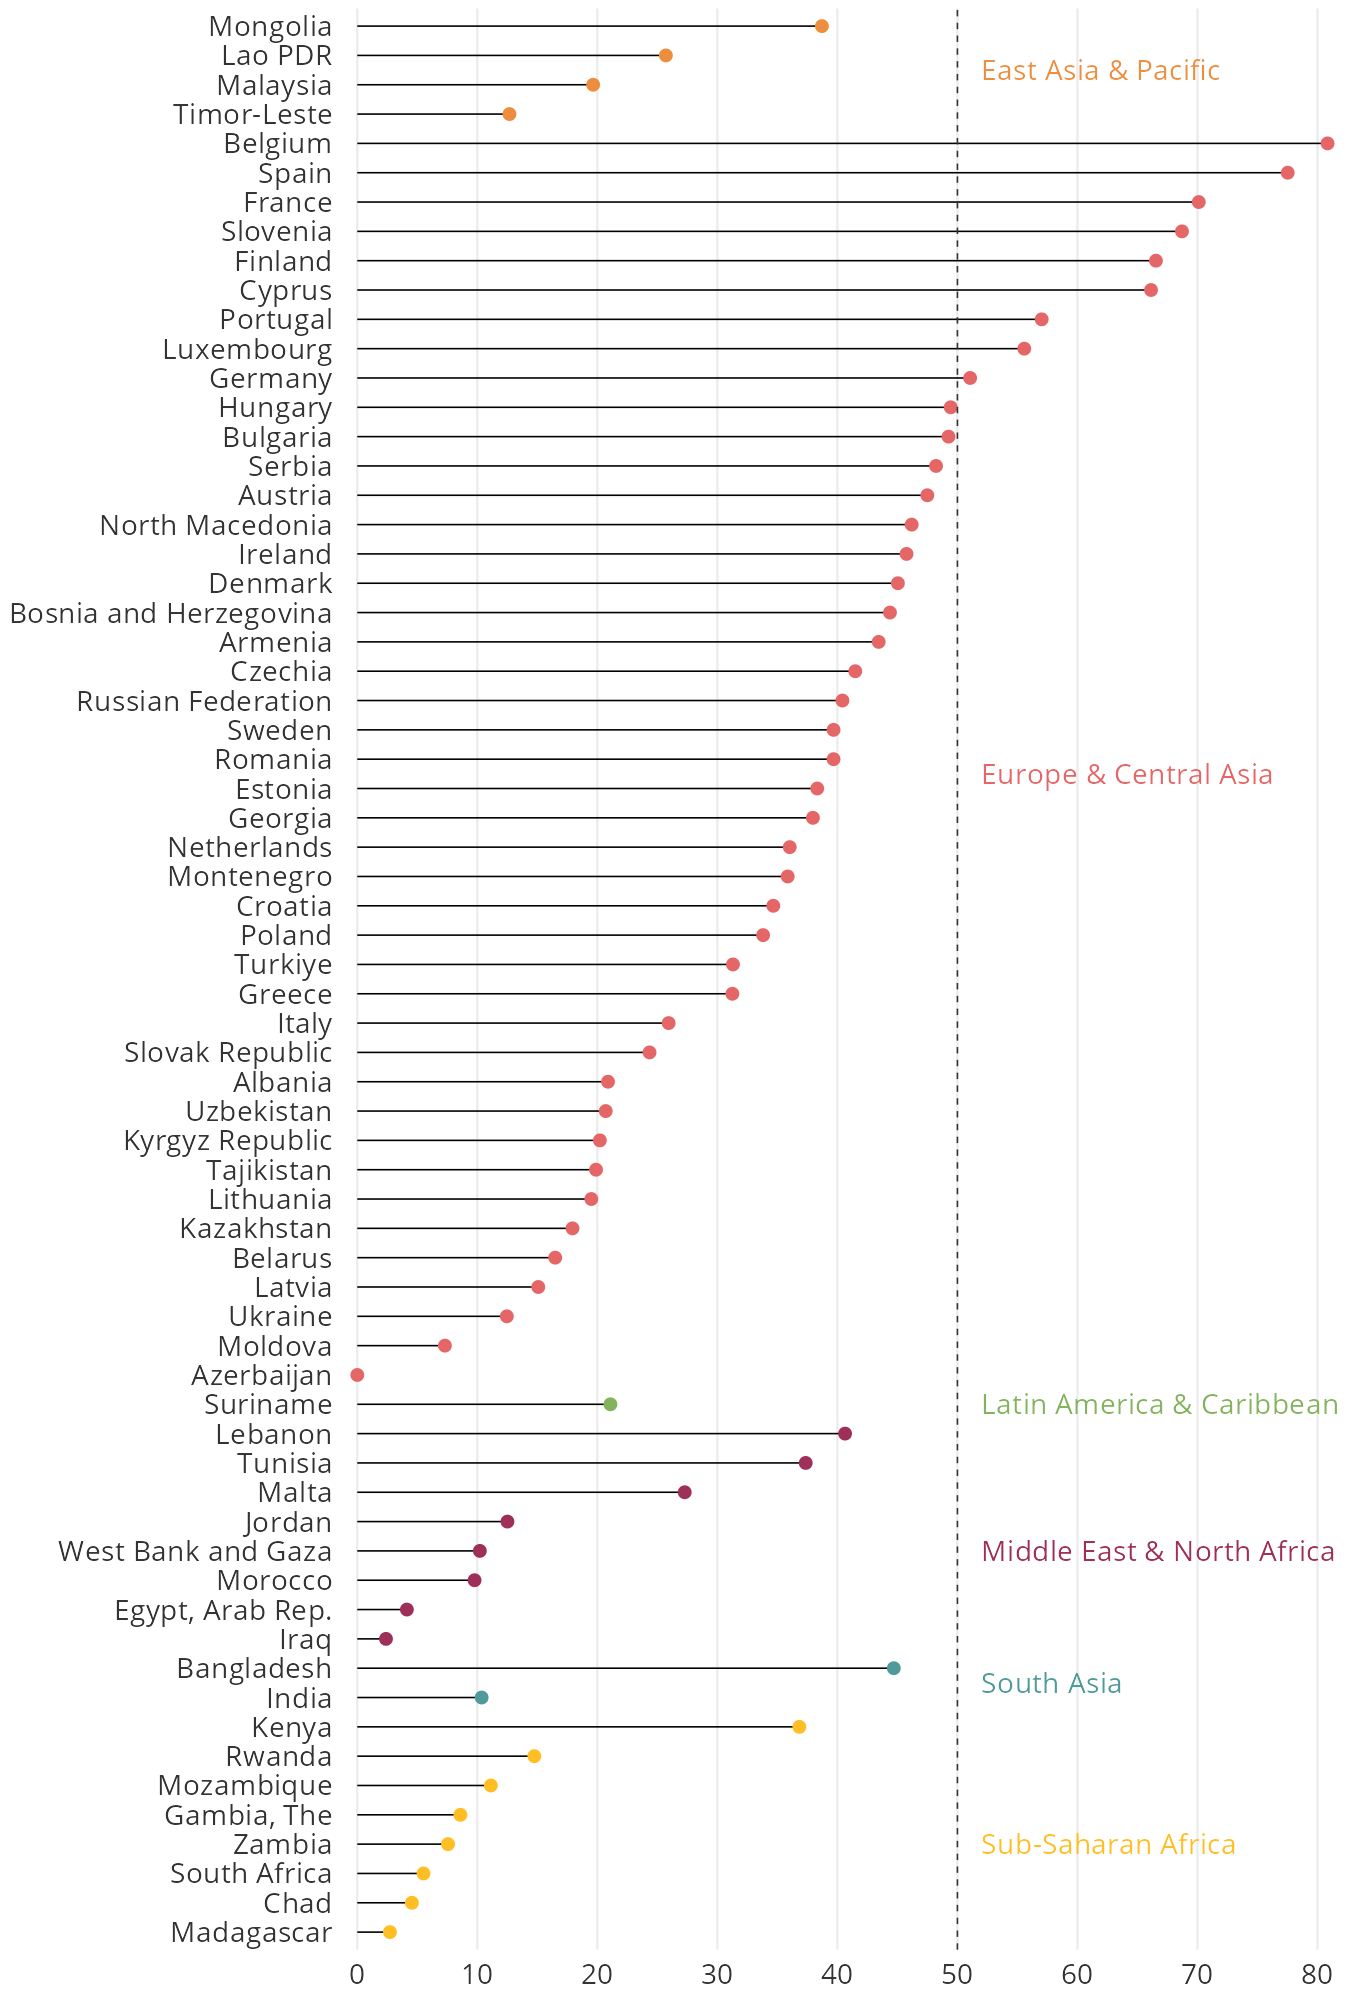
In 57 out of 66 countries with available data, less than half of the small-scale industries have a loan or line of credit.
Proportion of small-scale industries with a loan or line of credit, most recent value in 2018-23 (%)
Source: United Nations Industrial Development Organization (UNIDO), World Bank. Retrieved from [link: https://unstats.un.org/sdgs/dataportal/database UN SDG Portal (9.3.2).]DOWNLOAD
SDG target
9.5
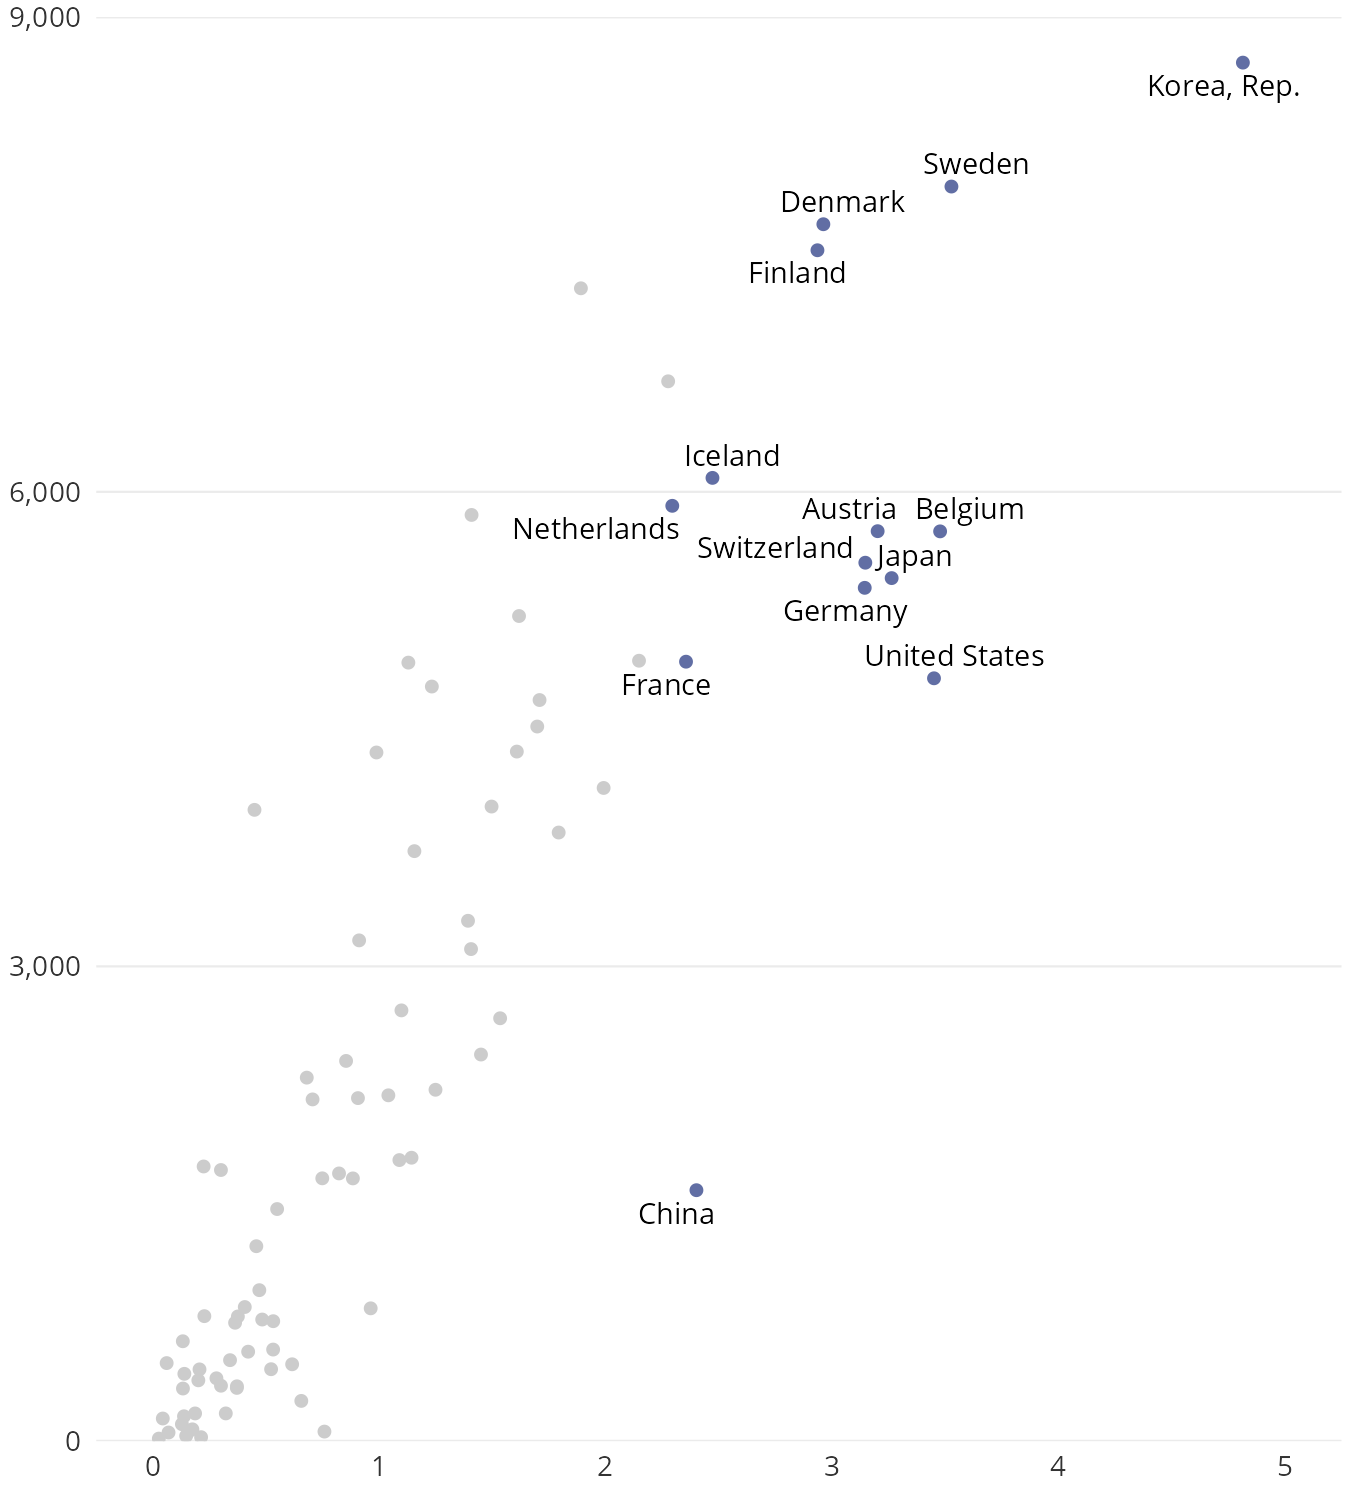
High income countries in Europe, the US, and East Asian countries (China, Japan, and Republic of Korea) are among the leading global investors in R&D, by % of GDP.
Research and development expenditure (% of GDP) (x axis) and Researchers in R&D (per million people) (y axis), most recent value in 2018-21
* The figure highlights the top 15 countries that allocate the highest percentage of their GDP to research and development (R&D). Israel ranked the first in R&D expenditure (% of GDP) but is excluded as data on researchers in R&D is unavailable.
Source: UNESCO Institute for Statistics (UIS). Retrieved from World Development Indicators ([link: https://data.worldbank.org/indicator/GB.XPD.RSDV.GD.ZS GB.XPD.RSDV.GD.ZS], [link: https://data.worldbank.org/indicator/SP.POP.SCIE.RD.P6 SP.POP.SCIE.RD.P6]).DOWNLOAD
SDG target
9.c.1
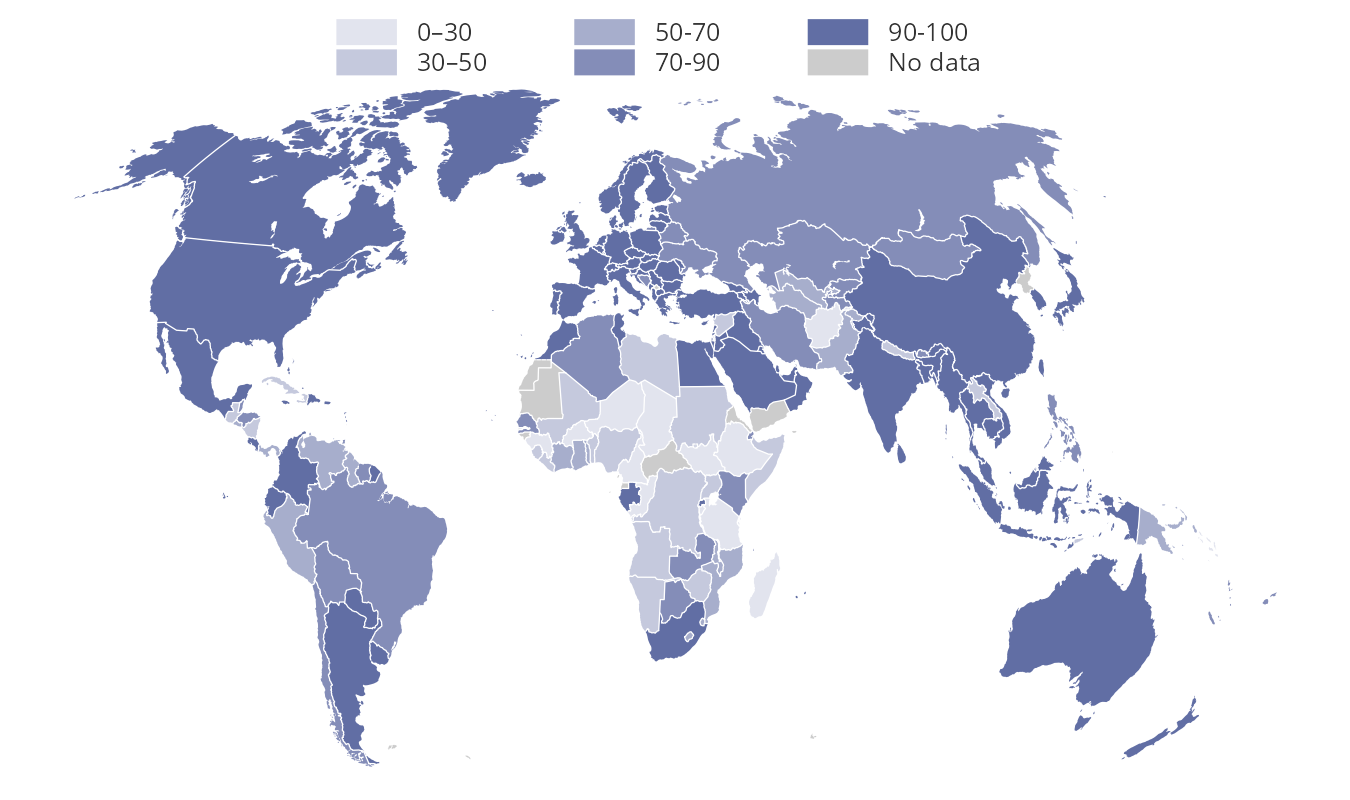
Many people in sub-Saharan Africa lack access to 4G mobile broadband networks.
Proportion of population covered by at least a 4G mobile network (%), 2020
Source: International Telecommunication Union (ITU). Retrieved from [link: https://unstats.un.org/sdgs/dataportal/database UN SDG Portal (9.c.1)]DOWNLOAD