No time to waste: A sustainability challenge for cities
Worldwide
[goal: 11] aims to make cities and communities inclusive, safe, resilient, and sustainable. Cities today face rising waste—particularly in the use of plastics—as populations grow and incomes rise. In 2020, the average person generated about 376 kilograms of waste—about six times an average person’s weight.
Municipal solid waste (referred to as waste hereafter) is a byproduct of material consumption. Uncollected or poorly managed waste leads to unhygienic conditions in communities and can severely impact people’s health.[reference: Solid waste. [link: https://www.who.int/tools/compendium-on-health-and-environment/solid-waste In: Compendium of WHO and other UN guidance on health and environment.] Geneva: World Health Organization; 2021 (WHO/HEP/ECH/EHD/21.02)][goal: 3] Managing waste is important for the environment also because it is a significant contributor to greenhouse gas emissions [goal: 13] and can cause land [goal: 15] and water pollution.[reference: United Nations Environment Programme (UNEP). 2023. [link: https://www.unep.org/explore-topics/resource-efficiency/what-we-do/cities/solid-waste-management#:~:text=Poor%20waste%20management%20%2D%20ranging%20from,cause%20infection%20and%20transmit%20diseases. Cities: Solid waste management.] Accessed June 6, 2023.][goal: 14]
Global waste produced per person is [emphasis: six times heavier] than the weight of an average person today.[footnote: assuming a person weighs 62 kg on average.[reference: Walpole, S.C., Prieto-Merino, D., Edwards, P. et al. [link: https://doi.org/10.1186/1471-2458-12-439 The weight of nations: an estimation of adult human biomass. BMC Public Health 12, 439 (2012).]]]
Waste generation is related to a country’s population, urbanization, and income level
Waste generated by country (total and per capita), 2020
In 2020, total waste produced ranged from less than 4,000 tonnes in Tuvalu, a small island country (population 11,000 in 2020), to nearly 400 million tonnes in China (population 1.4 billion in 2020). This is unsurprising as the quantity of waste is closely related to a country’s population. A higher population leads to more material consumption and, as a result, more waste.
However, a country’s waste output is not strictly proportional to its population. For example, the United States accounts for about 5 percent of the global population, but generates about 14 percent of global waste. When we adjust these numbers for population, we can see how much waste is generated per person in each country. Among the top five largest producers of waste per capita (US Virgin Islands, Bermuda, Faroe Islands, Monaco, and Puerto Rico), four are small island countries.
Many small island nations produce more waste per capita because they are densely populated with high levels of urbanization. Services provided in cities often lead to higher material consumption, and more waste as a result.
Waste generation is correlated with a country’s population, urbanization, and income.
Future of waste
The expected increases in population, income and urbanization mean waste will continue to grow, at a pace estimated to be almost triple that of population growth.[reference: World Bank. 2019. [link: https://www.worldbank.org/en/topic/urbandevelopment/brief/solid-waste-management#:~:text=With%20rapid%20population%20growth%20and,3.88%20billion%20tonnes%20in%202050. Brief: Solid Waste Management.] September 19. Accessed June 6, 2023.] Global population is expected to rise 25 percent from 7.5 billion in 2020 to about 9 billion people in 2050. Meanwhile, waste is expected to grow from 2.2 billion tonnes in 2020 to 2.8 billion tonnes by 2030 and to 3.9 billion tonnes by 2050 – a total increase of 73 percent.
Global waste will grow at three time the pace as global population
The growth in waste has historically come from upper-middle income and high-income countries. But now, waste generation in high income countries is no longer accelerating. In the next 30 years, the fastest growth in waste generation is estimated to come from middle income countries.
In terms of total waste production, upper-middle income (with a population of around 2.5 billion) already produce more waste than high income countries (with 1.25 billion people). Lower-middle income countries will surpass high-income countries’ waste production by 2030. Waste from upper-middle income economies is projected to increase by about 70 percent (from 770 million tonnes to 1.3 billion tonnes), and the amount generated by lower-middle income economies is projected to more than double (from 520 million tonnes to 1.2 billion tonnes) by 2050.
Waste generated by middle income countries will rise sharply over the next three decades
Total waste generation (million tonnes, 2020-2050)
Waste generation per capita is projected to increase across all income groups. While the sharpest rise in waste will come from lower-middle income countries (increase by 71 percent) and upper-middle income countries (increase by 58 percent), the largest contribution per person will still come from high income economies. By 2050, waste generation from upper-middle income countries will resemble that of high income economies.
Waste per capita will steadily rise across all income levels
Waste generation per capita (million tonnes, 2020-2050)
Municipal solid waste is only one element in a larger picture: there are other types of waste such as industrial, agricultural, construction, electronic, and hazardous and medical waste.[reference: United States Environmental Protection Agency (USEPA). 2023. [link: https://www.epa.gov/report-environment/wastes#:~:text=Many%20different%20types%20of%20waste,fossil%20fuel%20combustion%20waste%2C%20and What are the trends in wastes and their effects on human health and the environment? March 2. Accessed June 6, 2023.] Industrial waste is largest in quantity, followed by agricultural waste. While municipal solid waste is a small subset, it requires significant resources and sound policy for effective management.
In low- and middle-income countries, food and greens make up more than half of all waste.[footnote: Food and green waste refers to waste from food production, processing and consumption, and dried leaves and other greens from yards and gardens.][goal: 12] Food loss is a major contributor to waste and results from lack of proper handling or storage, processing or distribution. For example, in Sub-Saharan Africa, 72 percent of the food lost or wasted is mismanaged during production or handling. In contrast, in high-income countries, food is wasted mostly at the stage of consumption.[reference: Braich, G., V. Ricciardi and Y. Serkez. 2020. [link: https://datatopics.worldbank.org/sdgatlas/archive/2020/goal-12-responsible-consumption-and-production/ Managing plastic and food waste for a sustainable future] In Atlas of the Sustainable Development Goals 2020: From World Development Indicators, edited by A. F. Pirlea, U. Serajuddin, D. Wadhwa, M. Welch and A. Whitby. Washington, DC: World Bank. License: Creative Commons Attribution CC BY 3.0 IGO] In North America, for example, 58 percent of food loss or waste is at the consumer level.[reference: Flanagan, Katie, Kai Roberston, and Craig Hanson. [link: https://files.wri.org/d8/s3fs-public/reducing-food-loss-waste-global-action-agenda_1.pdf Reducing Food Loss and Waste: Setting a Global Action Agenda]. World Resources Institute.]
Food loss and waste is a global concern, given that more than 800 million people were still in hunger in 2021.[goal: 2] Food loss and waste has a significant environmental impact as well. Decaying food releases methane, which contributes to greenhouse gas emissions.[reference: Buzby, Jean. 2022. [link: https://www.usda.gov/media/blog/2022/01/24/food-waste-and-its-links-greenhouse-gases-and-climate-change#:~:text=Food%20loss%20and%20waste%20also,even%20more%20potent%20greenhouse%20gas Food Waste and its Links to Greenhouse Gases and Climate Change]. January 24. Accessed June 6, 2023.] The losses also lead to wastage of resources used to produce food, such as, land, labor, water, energy, and transport, and leads to a larger carbon footprint.[reference: Flanagan, Katie, Kai Roberston, and Craig Hanson. [link: https://files.wri.org/d8/s3fs-public/reducing-food-loss-waste-global-action-agenda_1.pdf Reducing Food Loss and Waste: Setting a Global Action Agenda]. World Resources Institute.][goal: 13]
In high-income countries, inorganic materials make up more than half of all waste. Plastic is the largest component: 12 percent of all waste in high-income countries is plastic. Although sometimes recyclable, plastic poses a major threat as it persists in the environment, resulting in land and water pollution, and potentially harmful consequences for public health.[reference: World Bank, 2022. [link: https://www.worldbank.org/en/news/immersive-story/2022/07/01/unpacking-the-plastics-challenge Unpacking the Plastics Challenge: Using Knowledge, Policies, and Innovation to Improve Lives]. July 1.]
How is waste managed?
For waste to be managed well, it first must be collected. SDG indicator 11.6.1 measures the share of waste collected and managed in controlled facilities. Collection rates vary widely across countries. It is nearly universal in high-income countries, but in low-income countries only about 40 percent of the waste is collected.
In low- and middle-income countries, more than half of the waste goes uncollected
Waste-to-energy incineration can be productive as trash can act as an energy source, reduce the pressure on landfill sites, thereby preventing the harmful effects of waste from uncontrolled landfill sites or open dumping.[reference: UNEP (2019). [link: https://www.unep.org/ietc/resources/publication/waste-energy-considerations-informed-decision-making Waste-to-Energy: Considerations for Informed Decision-Making]] However, incineration can lead to pollution that can be detrimental to human health and the environment.[reference: Sharma R, Sharma M, Sharma R, Sharma V. [link: https://doi.org/10.1515/reveh-2012-0035 The impact of incinerators on human health and environment]. Rev Environ Health. 2013;28(1):67-72.] While emission control technology is often used to minimize the environmental impact of waste incineration, these systems must be properly managed.[reference: Liu, Chen, Toru Nishiyama, Katsuya Kawamoto, and So Sasaki. 2020. [link: https://www.unep.org/ietc/resources/toolkits-manuals-and-guides/waste-energy-incineration#:~:text=While%20WtE%20incineration%20is%20one,in%20a%20functioning%20MSW%20system CCET guideline series on intermediate municipal solid waste treatment technologies: Waste-to-Energy Incineration]. United Nations Environment Programme (UNEP).]
In low-income countries, most waste is openly dumped
The COVID-19 pandemic resulted in an unexpected increase in waste. To cope with lockdowns in 2020, households commonly hoarded food and other perishables, which led to increased food loss and waste. For reasons of safety and hygiene, the use of disposable products like face masks and personal protection equipment (PPE) kits increased sharply.[reference: Dwi Hantoko, Xiaodong Li, Agamuthu Pariatamby, Kunio Yoshikawa, Mika Horttanainen, Mi Yan, [link: https://doi.org/10.1016/j.jenvman.2021.112140 Challenges and practices on waste management and disposal during COVID-19 pandemic, Journal of Environmental Management], Volume 286, 2021, 112140, ISSN 0301-4797.]
Waste from face masks
21thousand tons
per day in 2020
In 2020, 7 billion masks were being used on a daily basis. This resulted in 21,000 tons of waste per day just from face mask disposal.[reference: Dwi Hantoko, Xiaodong Li, Agamuthu Pariatamby, Kunio Yoshikawa, Mika Horttanainen, Mi Yan, [link: https://doi.org/10.1016/j.jenvman.2021.112140 Challenges and practices on waste management and disposal during COVID-19 pandemic, Journal of Environmental Management], Volume 286, 2021, 112140, ISSN 0301-4797.]
As hospitals experienced a surge in patients, medical waste also increased sharply.[reference: [link: https://wedocs.unep.org/bitstream/handle/20.500.11822/33416/WMC-19.pdf?sequence=1&isAllowed=y Global analysis of healthcare waste in the context of COVID-19: status, impacts and recommendations]. Geneva: World Health Organization; 2022. License: (CC BY-NC-SA 3.0 IGO).] In total, over 240,000 tons of medical waste was generated everyday in 2020.[reference: Dwi Hantoko, Xiaodong Li, Agamuthu Pariatamby, Kunio Yoshikawa, Mika Horttanainen, Mi Yan, [link: https://doi.org/10.1016/j.jenvman.2021.112140 Challenges and practices on waste management and disposal during COVID-19 pandemic, Journal of Environmental Management], Volume 286, 2021, 112140, ISSN 0301-4797.]
More waste was also generated by an increase in food deliveries that relied on plastic packaging, and the use of cleaning agents including sanitizers in plastic containers. Plastic waste stood out due to much higher consumption of single-use products including wrappings and packaging as well as personal hygiene items. About 1.6 million tons of plastic waste was generated daily in 2020.[reference: Nsikak U. Benson, David E. Bassey, Thavamani Palanisami, [link: https://doi.org/10.1016/j.heliyon.2021.e06343 COVID pollution: impact of COVID-19 pandemic on global plastic waste footprint], Heliyon, Volume 7, Issue 2, 2021, E06343, ISSN 2405-8440.] However, plastic waste was rising sharply even before the pandemic.
Source: OECD (2022), [link: https://doi.org/10.1787/de747aef-en Global Plastics Outlook: Economic Drivers, Environmental Impacts and Policy Options], OECD Publishing, Paris.
The quantity of plastic waste generated has more than doubled in the last 20 years, from 156 million tonnes in 2000 to 360 million tonnes in 2020. Depending on the type of plastic, it can take from hundreds of years to a million years to decompose. Recycling is the most efficient way to manage plastic waste and avoid harmful environmental impacts.
Recycling has also increased, from fewer than 6 million tonnes in 2000 to about 34 million tonnes in 2020. Yet the global rate of plastic recycling remains low: about 10 percent of total plastic use in 2020. Almost a fourth of all plastic waste is mismanaged, that is, inadequate collection or disposal of waste, and risking leakage into the environment. About half of plastic waste ends up in landfills.
The growth in plastic waste is expected to continue almost tripling by 2060. Nearly half a billion tonnes of plastic waste will be generated by 2030 and one billion tonnes by 2060.
Without new policies, 15 percent of this waste may still continue to be mismanaged, and half will end up in landfills. Even by 2060, only less than a fifth of the plastic waste will be recycled.
Source: OECD (2022), [link: https://doi.org/10.1787/de747aef-en Global Plastics Outlook: Economic Drivers, Environmental Impacts and Policy Options], OECD Publishing, Paris.
Plastic waste is especially difficult to recycle. It needs to be melted as part of the recycling process, but there are thousands of different types of plastic, which require separate processing. Together, this process of sorting, transporting and melting is time-consuming and expensive. In contrast, producing new plastic is much cheaper, reducing incentives for manufacturers to recycle.[reference: Nature. 2021. [link: https://doi.org/10.1038/d41586-021-00391-7 Chemistry can help make plastics sustainable — but it isn’t the whole solution.] nature 590, 363-364 (2021).]
In the process of recycling, plastic can disintegrate into smaller particles called microplastics, with particle sizes smaller than 5mm. Microplastics are especially harmful as they can leak into the environment where they can be ingested by animals, and enter drinking water supplies and oceans.[reference: Erina Brown, Anna MacDonald, Steve Allen, Deonie Allen, [link: https://doi.org/10.1016/j.hazadv.2023.100309 The potential for a plastic recycling facility to release microplastic pollution and possible filtration remediation effectiveness], Journal of Hazardous Materials Advances, Volume 10, 2023, 100309, ISSN 2772-4166.]
Plastic waste leakage
In 2019, 22 million tonnes of plastic waste leaked into the environment.[footnote: Due to the possibility of unreported leaks, this may be an underestimation.] Over 80 percent (19 million tonnes) of this leakage was due to mismanagement.[reference: OECD (2022), [link: https://doi.org/10.1787/de747aef-en Global Plastics Outlook: Economic Drivers, Environmental Impacts and Policy Options], OECD Publishing, Paris.]
Of the mismanaged plastic waste, about a third leaked into waterways, and a tenth reached the oceans. With plastics accumulating in marine environments every year, 30 million tonnes of plastic resided in the oceans by 2019.[reference: OECD (2022), [link: https://doi.org/10.1787/de747aef-en Global Plastics Outlook: Economic Drivers, Environmental Impacts and Policy Options], OECD Publishing, Paris.]
Only 20 percent of plastic in the oceans comes from waste generated or used on the coasts or from marine activities. Most of the plastic leaking into the oceans comes from inland sources, and subsequently carried into the seas through rivers.[reference: OECD (2022), [link: https://doi.org/10.1787/de747aef-en Global Plastics Outlook: Economic Drivers, Environmental Impacts and Policy Options], OECD Publishing, Paris.] This underscores the case that plastic waste must be well-managed everywhere, not just around the coasts, to protect the health of oceans.
Plastics and other debris that float offshore often get accumulated in ocean gyres. Ocean currents created by large wind movements are called gyres.[reference: National Oceanic and Atmospheric Administration, 2023. [link: https://oceanservice.noaa.gov/facts/gyre.html Ocean Facts: What is a gyre?]] There are five of these on earth. Marine debris has accumulated in each of the gyres, forming waste patches of different sizes. One such accumulation is the Great Pacific Garbage Patch between Hawaii and California.
It covers 1.6 million square kilometers of the Pacific Ocean, containing more than 1.8 trillion pieces of plastic and weighing 80,000 tonnes. About 60 percent of the plastic comes to the patch from the coastal population, followed by 18 percent from fishing activities.[reference: Lebreton, L., Slat, B., Ferrari, F. et al, 2018. [link: https://doi.org/10.1038/s41598-018-22939-w Evidence that the Great Pacific Garbage Patch is rapidly accumulating plastic]. Sci Rep 8, 4666.] This is in sharp contrast to plastic waste onshore, where inland populations are the largest contributors. This difference may reflect the types of plastics that make it into the gyre – items that float and don’t get washed up to the shore.
Most plastic waste reaching the Great Pacific Garbage Patch comes from coastal population
Plastic waste by source in the Great Pacific Garbage Patch (percent)
Source: Lebreton, L., Slat, B., Ferrari, F. et al, 2018. [link: https://doi.org/10.1038/s41598-018-22939-w Evidence that the Great Pacific Garbage Patch is rapidly accumulating plastic]. Sci Rep 8, 4666.
Plastic waste in the oceans poses serious threats to aquatic life.[goal: 14] Marine animals can become entangled in plastic waste or consume it, damaging their internal organs. The presence of plastics in the oceans may also deprive marine life of oxygen or food, leading to starvation or suffocation.[reference: United Nations Environment Programme (2021). [link: https://www.unep.org/resources/pollution-solution-global-assessment-marine-litter-and-plastic-pollution From Pollution to Solution: A global assessment of marine litter and plastic pollution]. Nairobi.] Humans may also be exposed through seafood contaminated by plastic. Its impact on humans has not been extensively studied, but is expected to adversely impact our health. Harmful effects on marine life also have implications for coastal communities that rely on fishing, tourism and other economic activities.[reference: United Nations Environment Programme (2021). [link: https://www.unep.org/resources/pollution-solution-global-assessment-marine-litter-and-plastic-pollution From Pollution to Solution: A global assessment of marine litter and plastic pollution]. Nairobi.]
Given that plastic has a long lifespan, its impact compounds over time and has serious consequences for humans as well as for animal life. To realize the goal of reducing the adverse impact of waste on the environment, and achieve [goal: 11], [goal: 13] and [goal: 14], plastic and other types of waste must be reduced, collected, and treated appropriately.
Learn more about
SDG
11
In the charts below you can find more facts about SDG {activeGoal} targets, which are not covered in this story. The data for these graphics is derived from official UN data sources.
SDG target
11.1.1
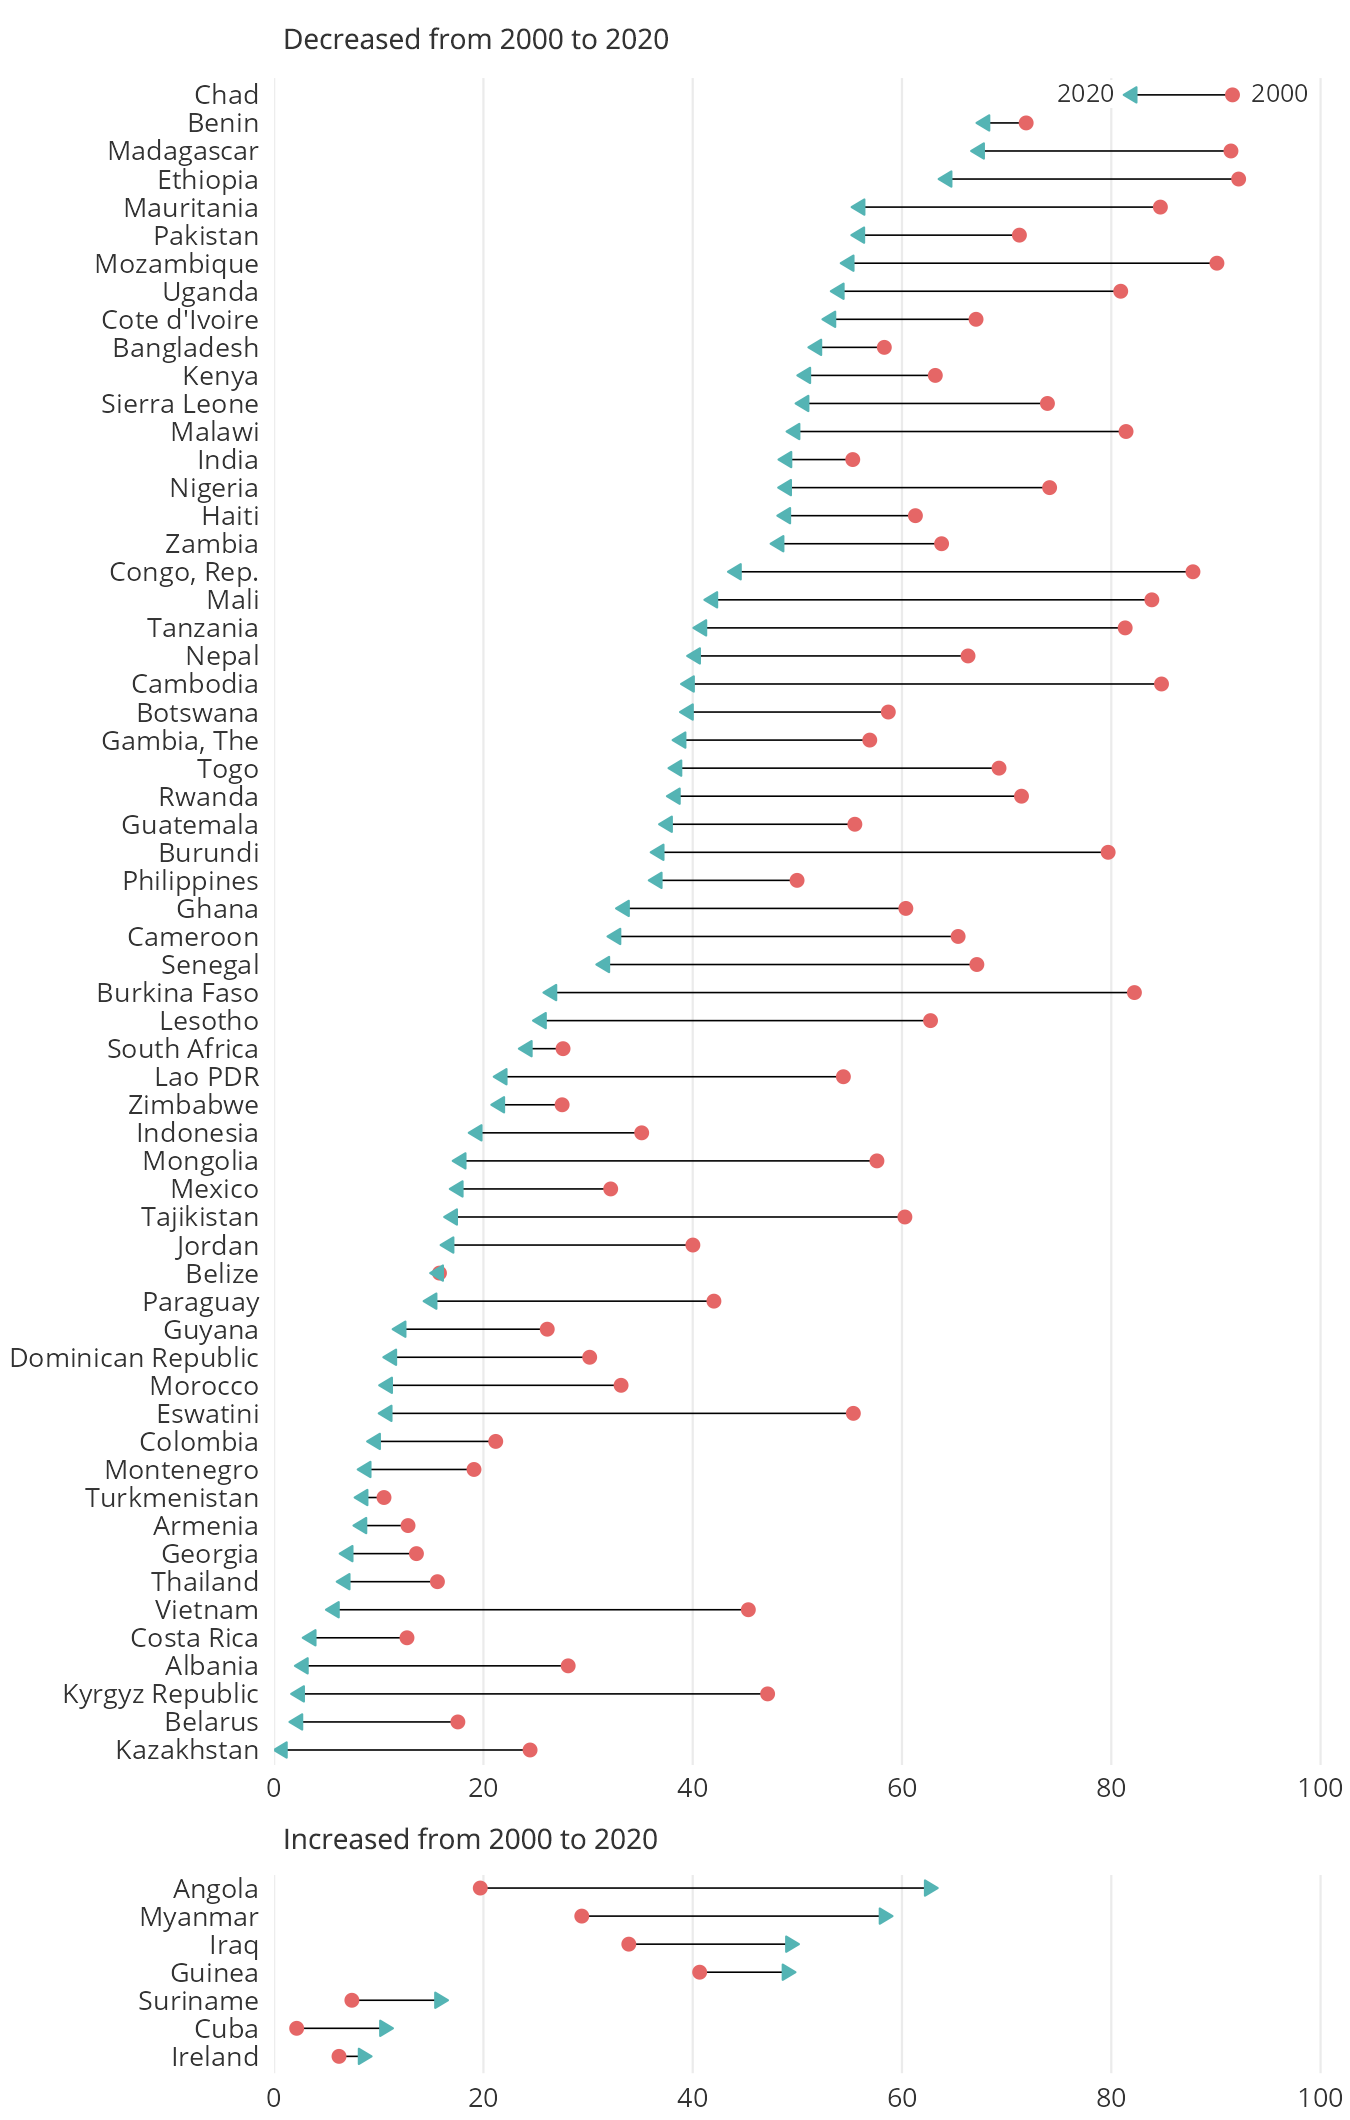
Over the past two decades, the share of urban residents living in slums decreased in most countries.
Proportion of urban population living in slums, 2000 and 2020 (%)
* The figure includes 67 countries that have available data for both the years 2000 and 2020.
Source: United Nations Human Settlements Programme (UN-HABITAT). Retrieved from World Development Indicators ([link: https://data.worldbank.org/indicator/EN.POP.SLUM.UR.ZS EN.POP.SLUM.UR.ZS]).DOWNLOAD
SDG target
11.2.1
Only half the world’s urban population has convenient access to public transport. Cities in low- and middle-income countries have the lowest access.
Proportion of population that has convenient access to public transport by city and income (%), 2020
* Each dot represents a city. Access to public transport is considered convenient when an officially recognized stop is accessible within a walking distance along the street network of 500 meters from a reference point such as a home, school, workplace, market, etc. to a low-capacity public transport system (e.g. bus, Bus Rapid Transit) and/or 1 km to a high-capacity system (e.g. rail, metro, ferry).
Source: United Nations Human Settlements Programme (UN-Habitat). Retrieved from [link: https://unstats.un.org/sdgs/dataportal/database UN SDG Portal (11.2.1)].DOWNLOAD
SDG target
11.6.2
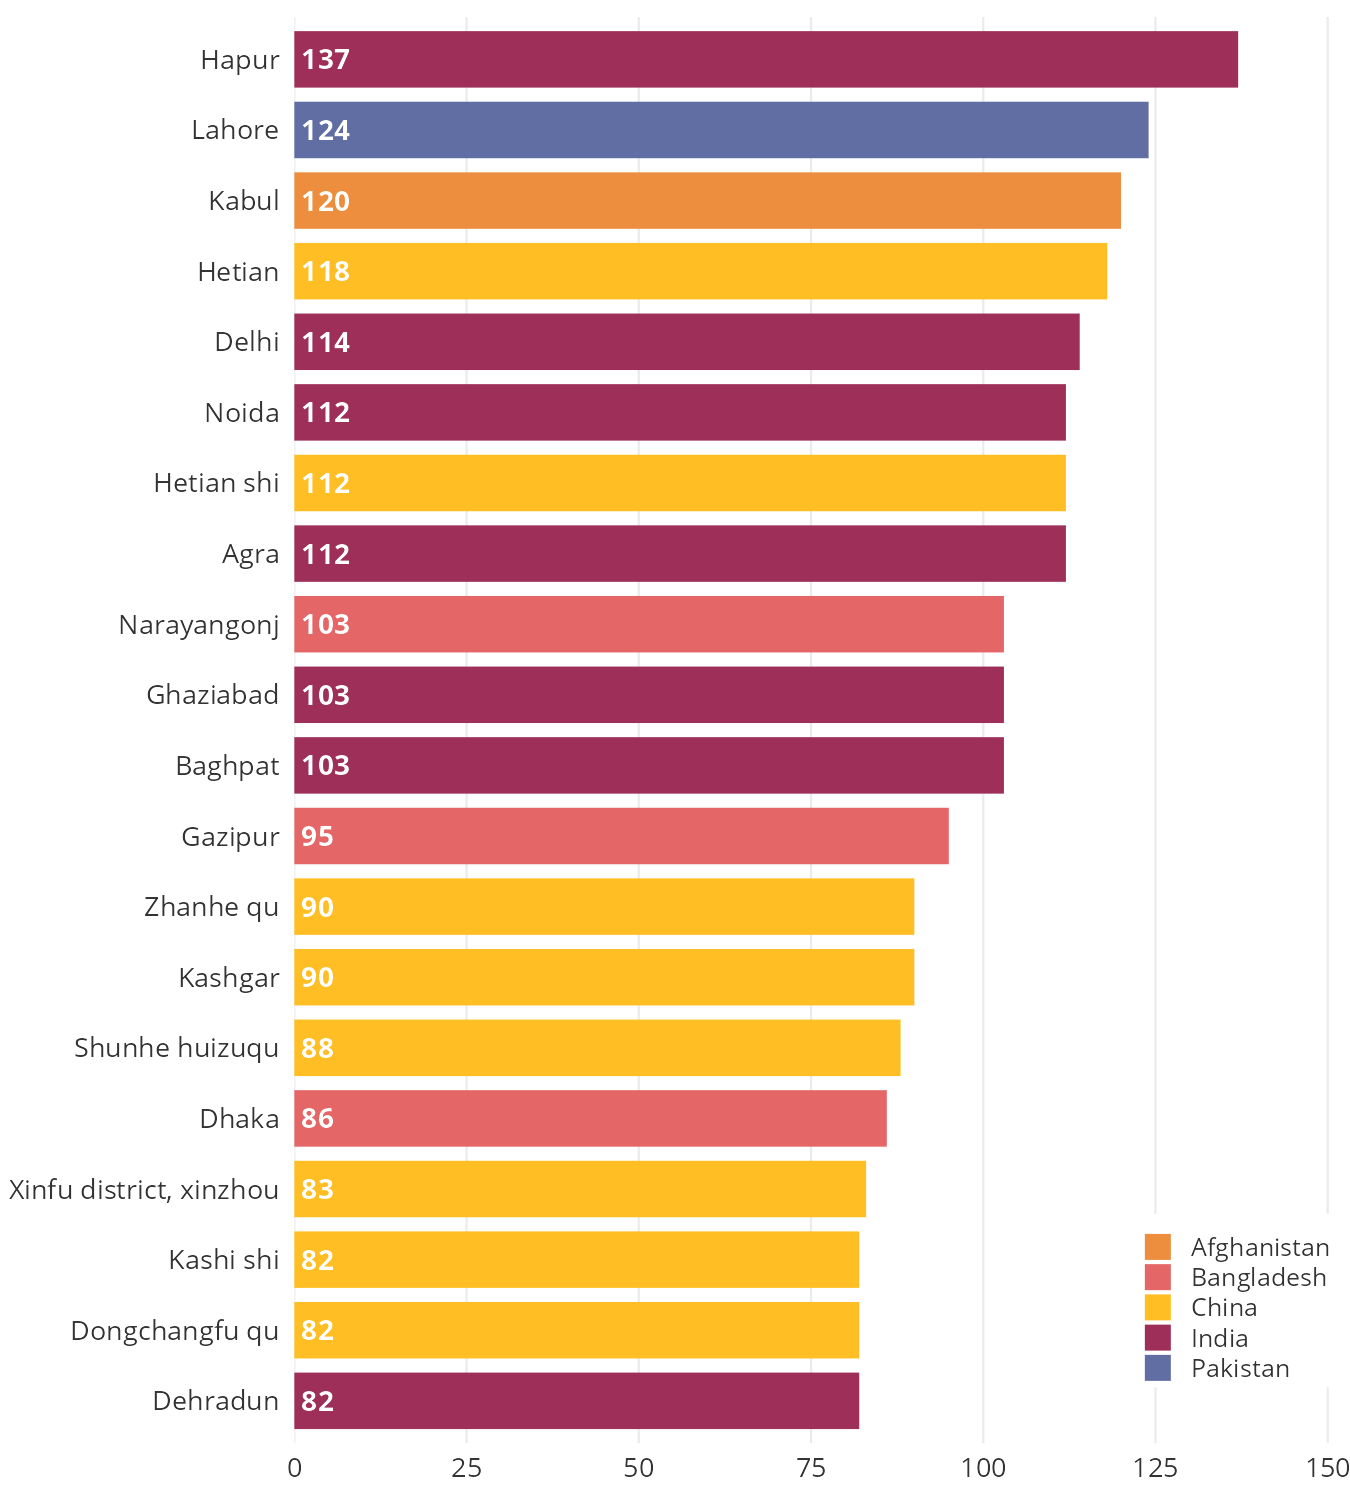
Of the 20 cities with the highest air pollution, 8 are in China, and 7 are in India.
Top 20 cities with the highest annual mean concentration of particulate matter with diameter of 2.5μm or less (PM 2.5), most recent value in 2018-20
Source: World Health Organization (WHO). [link: https://www.who.int/publications/m/item/who-ambient-air-quality-database-(update-2023) WHO Ambient Air Quality Database (Update 2023)].DOWNLOAD