Deforestation: Accelerating climate change and threatening biodiversity
Worldwide
[goal: 15] aims to protect, restore, and promote the sustainable use of terrestrial ecosystems and forests, to halt and reverse land degradation, and to put a stop to loss in biodiversity. In 2020, forests accounted for almost a third of global land area. Since 2000, forest area across the world has declined by 2.4 percent, an area equivalent to the size of Egypt.
Covering almost one third of the Earth’s land surface, forests offer a habitat to over 80 percent of all terrestrial species[reference: FAO and UNEP. 2020. [link: https://doi.org/10.4060/ca8642en The State of the World’s Forests 2020. Forests, biodiversity and people.] Rome.] and are key to preserving biodiversity. [target: 15.5] Forested watersheds and wetlands supply three quarters of all accessible freshwater in the world. [goal: 6][reference: World Bank. 2016. [link: https://www.worldbank.org/en/news/feature/2016/03/18/why-forests-are-key-to-climate-water-health-and-livelihoods Why Forests are Key to Climate, Water, Health, and Livelihoods.] Washington, DC.] Worldwide an estimated 300 to 350 million people live in or close to forests and largely depend on them for their livelihoods; over a billion people rely on forests for employment, forest products, and contributions to livelihoods and income.[reference: World Bank. 2016. [link: https://www.worldbank.org/en/news/feature/2016/03/18/why-forests-are-key-to-climate-water-health-and-livelihoods Why Forests are Key to Climate, Water, Health, and Livelihoods.] Washington, DC.] Many of those living in extreme poverty are highly dependent on forests for their livelihood.[reference: FAO. 2020. [link: https://www.fao.org/state-of-forests/en/ The State of the World’s Forests 2020.] Rome.] [goal: 1] Forests play a key role in the mitigation of climate change, removing an estimated 16 billion tons of carbon dioxide (CO2) from the atmosphere annually,[reference: Harris, Nancy L., David A. Gibbs, Alessandro Baccini, et al. 2021. [link: https://doi.org/10.1038/s41558-020-00976-6 Global maps of twenty-first century forest carbon fluxes]. Nature Climate Change 11, 234–240.] equalling about half of the annual CO2 released from burning fossil fuels. [goal: 13]
Forest area is unequally distributed
Forest cover varies across the globe – some countries are predominantly forest while others have little or none. Over a quarter of global forest land is located in Russia, Brazil, Canada, and China. In 40 countries forest cover accounts for less than 10 percent of their total land area. The share of a country’s land area that is forested is monitored under [target: 15.1].
Forest cover is unequally distributed across the globe
Source: Food and Agriculture Organization. Retrieved from World Development Indicators ([link: https://data.worldbank.org/indicator/AG.LND.FRST.ZS AG.LND.FRST.ZS]).
Forests can be divided into four groups: [emphasis: tropical, subtropical, temperate] and [emphasis: boreal forests]. Climatic conditions drive the types, levels of vegetation and biodiversity of forests. The amount of CO2 stored differs by forest type as well. As a result, the amount of greenhouse gases released into the atmosphere when forests are cleared varies considerably.
There are four main types of forests: tropical, subtropical, temperate and boreal
Source: Potapov, P. et al. 2020. [link: https://doi.org/10.1016/j.rse.2020.112165 Mapping and monitoring global forest canopy height through integration of GEDI and Landsat data.] Remote Sensing of Environment, 112165. and FAO. 2007. [link: https://data.apps.fao.org/map/catalog/static/api/records/68790fd0-690c-11db-a5a5-000d939bc5d8 Thermal climate zones of the world (FGGD)].
[emphasis: Tropical forests] are concentrated around the equator and make up about 45 percent of the world’s total. These forests are the richest in biodiversity and store the largest amount of carbon. The carbon density of tropical rain forests is twice as high as those in other regions.[reference: WRI. n.d. [link: https://research.wri.org/gfr/biodiversity-ecological-services-indicators/forest-carbon-stocks Forest Carbon Stocks].]
[emphasis: Subtropical forests], which account for some 11 percent of the total, are located to the north and south of tropical forests and are similar to tropical forests with respect to carbon storage and biodiversity. Subtropical forests are not as warm as those in tropical areas, and they experience dry and rainy seasons.
[emphasis: Temperate forests] are found mostly in Central and Western Europe, North America and East Asia and comprise around 16 percent of the world’s total. Temperate forests experience four seasons with a long growing season and cold dormant winters. They typically have lower levels of biodiversity than tropical and subtropical forests.
[emphasis: Boreal forests], consisting mainly of evergreen conifers, are found in regions with cold climates in the northern parts of Russia, Canada and Scandinavia as well as Alaska. Approximately 27 percent of global forests are boreal, which host fewer species and contain less carbon than other forest types.
Source: Potapov, P. et al. 2020. [link: https://doi.org/10.1016/j.rse.2020.112165 Mapping and monitoring global forest canopy height through integration of GEDI and Landsat data.] Remote Sensing of Environment, 112165. and FAO. 2007. [link: https://data.apps.fao.org/map/catalog/static/api/records/68790fd0-690c-11db-a5a5-000d939bc5d8 Thermal climate zones of the world (FGGD)].
Deforestation and forest degradation threaten the ability of forests to contribute to sustainable development
Forests are threatened by deforestation and degradation. The Food and Agriculture Organization (FAO) [reference: FAO. 2018. [link: https://www.fao.org/3/I8661EN/i8661en.pdf Terms and definitions – FRA 2020. Forest Resources Assessment Working Paper 188]. Rome.] defines [emphasis: deforestation] as the permanent transformation of forested areas to other land uses, such as agriculture or construction. [emphasis: Degraded forests] have been damaged by human activities like logging or climatic and environmental events such as wildfires to the extent that their productive capacity is severely diminished. Degradation diminishes the quality of a forest’s vegetation and biodiversity, rather than reducing the overall forested area.
The global rate of deforestation has slowed, but remains high
Net change in forest area between 2000 and 2020
-2.4%
World
Globally, between 2000 and 2020, forest area declined by 2.4 percent or close to 100 million hectares, an area similar to that of Egypt or Tanzania. This includes losses from deforestation offset in part by gains in lands that were restored (reforestation) or where new forests were created (afforestation). The rate of deforestation has declined from 16 million hectares annually in the 1990s to 10 million hectares annually during the period 2015-2020. Most deforestation takes place in tropical regions, whereas new forests are mostly created in other zones. Given that tropical forests hold higher levels of carbon and provide habitat for more species than other types of forests, this loss is particularly detrimental to global CO2 emissions and to biodiversity.
Losses and gains in forest land vary widely from country to country. Paraguay lost almost 30 percent of its forest between 2000 and 2020, mainly to convert land for cattle ranching. This contrasts with Vietnam, which implemented policies restricting logging and promoting reforestation, and increased forest area by 23 percent over the same period.
Countries with tropical and subtropical forests saw large losses between 2000 and 2020
Source: Food and Agriculture Organization (FAO). Retrieved from World Development Indicators ([link: https://data.worldbank.org/indicator/AG.LND.FRST.ZS AG.LND.FRST.ZS]).
Deforestation statistics do not tell the full story
Deforestation describes the permanent loss of forests or tree cover to non-forest use due to human activities. It does not adequately account for temporary tree cover losses. An alternative measure is that of tree cover loss, calculated using satellite imagery and remote sensing. This metric measures the reduction in tree canopy cover. Some of these losses come from temporary natural factors such as wildfires, but also from human activities such as logging, urbanization or agriculture.[reference: Global Forest Watch. 2022. [link: https://data.globalforestwatch.org/documents/gfw::tree-cover-loss/about Tree Cover Loss].] These losses can be temporary or become permanent. Even when temporary, tree cover loss impacts forests’ ability to mitigate the effects of greenhouse gas emissions and support biodiversity.
Tree cover loss between 2000 and 2021
11%
Globally
Total global tree cover loss between 2000 and 2021 was 11 percent.[footnote: Tree cover loss is measured at 30 percent canopy cover] The loss in 2021 alone was around 25 million hectares, an area comparable to the size of Uganda, Ecuador or the United Kingdom.
The five main drivers of tree cover loss are commodity-driven agriculture, urbanization, shifting agriculture, forestry, and wildfires
Remote sensing techniques can be used to determine the causes of tree cover loss.[reference: Curtis, Philip G., Christy M. Slay, Nancy L. Harris, Alexandra Tyukavina, and Matthew C. Hansen. 2018. [link: https://doi.org/10.1126/science.aau3445 Classifying drivers of global forest loss]. Science 361, Issue 6407: 1108-11.] Commodity-driven agriculture, where forests are cleared to produce large-scale commodities, such as soy, palm oil, beef, pulp and paper, or for mining for energy and minerals, is [emphasis: permanent] and involves a change in how land is used. So is urbanization, where trees make place for urban settlements. Other drivers often cause [emphasis: temporary] tree cover loss. Shifting agriculture , where small-holder farmers clear land plots for temporary cultivation, often leads to temporary tree cover loss, as plots are abandoned after some time and forests can regrow. Forestry is the large-scale harvesting of trees, and trees are typically replanted in the same soil. Tree cover lost due to wildfires regrows as well.
More than three quarters of tree cover loss is caused by temporary drivers
Share of global tree cover loss in the period 2000-2021 by driver
Source: The Sustainability Consortium, World Resources Institute, and University of Maryland. [link: https://www.globalforestwatch.org/ Tree Cover Loss by Driver].
The largest share of permanent tree cover loss occurred in the tropics, where the impact on biodiversity and the climate is the heaviest.
Tree cover loss in Latin America & Caribbean and East Asia & Pacific is dominated by permanent drivers
Share of each driver of tree cover loss in the period 2000-2021 by region
Source: The Sustainability Consortium, World Resources Institute, and University of Maryland. [link: https://www.globalforestwatch.org/ Tree Cover Loss by Driver].
Commodity production is the main driver of tree cover loss in Latin America and Southeast Asia
Commodity-driven clearing to produce agricultural products such as beef and soy, and for mining of energy products and minerals, is the main driver of tree cover loss in the tropical forests of Latin America (59 percent) and Southeast Asia (80 percent). Examples are palm oil production in Indonesia and soybean production and cattle ranching in Brazil. Commodity-driven deforestation is often permanent.
Commodity-driven tree cover loss in Santa Cruz, Bolivia
Tree cover in 2000 and cumulative tree cover loss, 2001-2021
Source: Hansen, Matthew C., et al. 2013. [link: https://glad.earthengine.app/view/global-forest-change High-Resolution Global Maps of 21st-Century Forest Cover Change.] Science 342 (15 November): 850–53.
In Bolivia, over 85 percent of the tree cover loss in 2021 was caused by commodity-driven deforestation. Despite its relatively small size, Bolivia ranked third globally in terms of loss of primary forest in 2021, after Brazil and the Democratic Republic of Congo.[footnote: Primary forests are forests without any significant disturbances by human interference and having reached the final development stage.] The area of Santa Cruz in Bolivia is a center of agriculture where large swaths of tropical dry forests are cleared for growing soybeans and cattle ranching.
Source: Hansen, Matthew C., et al. 2013. [link: https://glad.earthengine.app/view/global-forest-change High-Resolution Global Maps of 21st-Century Forest Cover Change.] Science 342 (15 November): 850–53.
Shifting agriculture is the main driver of tree cover loss in the tropical forests in Africa
Shifting agriculture – clearing forests for temporary cultivation – drives around 94 percent of tree cover loss in the tropical forests on the African continent. Because primary rainforests typically take very long to recover, the detrimental impact on biodiversity of this practice is significant.[reference: Kadoya, Taku, Yayoi Takeuchi, Yushin Shinoda, et al. 2022. [link: https://doi.org/10.1038/s43247-022-00434-5 Shifting agriculture is the dominant driver of forest disturbance in threatened forest species’ ranges] Communications Earth Environment 3, 108.]
Shifting agriculture in northern Democratic Republic of Congo
Tree cover in 2000 and cumulative tree cover loss, 2001-2021
Source: Hansen, Matthew C., et al. 2013. [link: https://glad.earthengine.app/view/global-forest-change High-Resolution Global Maps of 21st-Century Forest Cover Change.] Science 342 (15 November): 850–53.
In the Congo River Basin in the Democratic Republic of Congo, which hosts the second largest primary rainforest in the world, nearly all tree cover loss between 2001 and 2021 was driven by shifting agriculture. Small-scale clearing of tropical forest by agricultural smallholders more than doubled between 2001 and 2021. Patches of forest are also burned to produce firewood and charcoal which are used for cooking by about 90 percent of the country’s population of about 95 million.
Source: Hansen, Matthew C., et al. 2013. [link: https://glad.earthengine.app/view/global-forest-change High-Resolution Global Maps of 21st-Century Forest Cover Change.] Science 342 (15 November): 850–53.
More frequent and intense wildfires – due to climate change – are an important factor in increased tree cover loss
Increased droughts and heat waves due to climate change have caused wildfires to become a more important driver of tree cover loss over the past decades with fires growing in frequency, intensity and magnitude. In 2021, more than a quarter of global tree cover loss was due to wildfires. Wildfires occur mainly in temperate and boreal forest in Northern America, Europe, Russia, and Australia.
Tree cover loss due to wildfires in Yakutsk, Russia
Tree cover in 2000 and cumulative tree cover loss, 2001-2021
Source: Hansen, Matthew C., et al. 2013. [link: https://glad.earthengine.app/view/global-forest-change High-Resolution Global Maps of 21st-Century Forest Cover Change.] Science 342 (15 November): 850–53.
Wildfires have been the main driver of tree cover loss in Russia, accounting for more than three quarters of total tree cover loss in the past decade. In 2021, 55,200 square kilometers of forest was lost to fires. This is an area similar in size to that of Croatia or Costa Rica.
Source: Hansen, Matthew C., et al. 2013. [link: https://glad.earthengine.app/view/global-forest-change High-Resolution Global Maps of 21st-Century Forest Cover Change.] Science 342 (15 November): 850–53.
Forests help slow climate change
Forests play an important role in fighting climate change. [emphasis: Carbon sequestration] is the process of absorbing carbon dioxide (CO2) from the atmosphere and storing it in the trees and soil. CO2 is one of the main greenhouse gases and the increasing concentration of these gases in the atmosphere causes the Earth to warm. [goal: 13] The capacity for global forests to absorb CO2 from the atmosphere is reduced by deforestation and forest degradation; with fewer trees to sequester CO2, that means higher concentrations of CO2 in the atmosphere.
In 2019, global human-caused greenhouse gas emissions were about 48 Gigatons (Gt) CO2e.[footnote: Besides CO2, other important greenhouse gases are methane (CH4), nitrous oxide (N2O) and fluorinated gases (F-gases). Each of these gases has their own global warming potential (GWP), which is used to compare the effect of other gases to the effect of CO2. The emissions are expressed using the unit CO2e, which is the equivalent amount of CO2 that has a similar greenhouse gas effect. One gigaton (Gt) is equivalent to one billion metric tons.] Annually, forests sequester an estimated 16 Gt of carbon dioxide (CO2). This amounts to a third of annual CO2 emissions, or the combined CO2 emissions of China, the United States and Indonesia in 2019. However, when forest is lost, the CO2 stored in the trees and soil is partially emitted to the atmosphere.
Global forests remove 16 Gigatons CO2 annually from the atmosphere
Average annual forest greenhouse gas removals (2001-2021)
Source: Harris, Nancy L., David A. Gibbs, Alessandro Baccini, et al. 2021. [link: https://doi.org/10.1038/s41558-020-00976-6 Global maps of twenty-first century forest carbon fluxes.] Nature Climate Change. 11, 234–240., World Resource Institute (WRI).
Global tropical rainforests sequester more CO2 than boreal and temperate forests combined.
CO2 emissions caused by loss of trees, for instance caused by logging or wildfires, was an average 8.1 Gt annually over the past 20 years, which is roughly half the CO2 that is removed from the atmosphere by forests.
The CO2 released as a result of tree cover loss partially offsets the removal. The net effect is a removal of 7.6 Gt of CO2 annually, which is about one fifth to the total global CO2 emissions from other sources.
Deforestation is high in tropical rainforests. This causes the tropical rainforests in Southeast Asia to be a net source of CO2 emissions, with the remaining trees unable to absorb the CO2 released by forests lost in a given year.
The rainforests in the Amazon and Congo river basins are still a net ‘sink’, meaning they absorb more CO2 than the amount of emission caused by forest loss.
Source: Harris, Nancy L., David A. Gibbs, Alessandro Baccini, et al. 2021. [link: https://doi.org/10.1038/s41558-020-00976-6 Global maps of twenty-first century forest carbon fluxes.] Nature Climate Change. 11, 234–240., World Resource Institute (WRI).
To slow climate change, critical steps include protecting forests, reforestation and afforestation as well as restoring degraded forests. These measures can increase the amount of CO2 sequestered by forests and reduce emissions caused by deforestation and forest loss.
Deforestation imperils biodiversity
Deforestation and forest degradation are threats to biodiversity, as forests provide the habitat for more than 80 percent of all species of animals, plants and insects worldwide. [target: 15.5] seeks to reduce the degradation of habitats to halt the loss of biodiversity and extinction of species. The greatest threat to plants and animals is the destruction of their habitat.[reference: WWF. 2020. [link: https://www.worldwildlife.org/publications/living-planet-report-2020 Living Planet Report 2020 - Bending the curve of biodiversity loss.] Almond, R.E.A., Grooten M. and Petersen, T. (Eds). WWF, Gland, Switzerland.]
Share of species threatened with extinction
28%
of 147,517 species assessed
The International Union for Conservation of Nature’s (IUCN) Red List of Threatened Species seeks to categorize all species on the planet according to the extinction risk they face. Of nearly 150,000 species evaluated, 28 percent of these are classified as threatened with extinction.[reference: IUCN. 2022. [link: https://www.iucnredlist.org The IUCN Red List of Threatened Species.] Version 2022-2.] The information in the Red List of Threatened Species can be used to guide conservation efforts.
The Red List Index shows a large decline in biodiversity
The Red List Index (RLI),[footnote: The [link: https://www.iucnredlist.org/assessment/red-list-index IUCN Red List Index (RLI)] summarizes the status of biodiversity in a country by assigning a score between 0 and 1 reflecting the extinction risks of species in that country: 1 means all species are classified as Least Concern and not at risk of extinction in the near future, while 0 indicates that all species in a country have become extinct. The RLI is helpful in tracking changes in threats to species, as it only takes into account category updates, and is not sensitive to the total number of species in the Red List of Threatened Species, which can change due to addition of new species, regardless of their status.] an official SDG indicator, is used to track the risk of extinction for species and monitor progress towards [target: 15.5]. Developments in the RLI show that biodiversity is facing increased pressure.
Biodiversity has declined in most countries, especially in the tropics where biodiversity is highest
Source: International Union for Conservation of Nature (IUCN), BirdLife International; Retrieved from [link: https://unstats.un.org/sdgs/dataportal/database UN Global SDG Indicator Database (15.5.1)].
Designating protected areas can be positive for biodiversity
Protected areas can help conserve biodiversity and mitigate climate change.[reference: IUCN. 2023. [link: https://www.iucn.org/our-work/topic/effective-protected-areas Effective protected areas].] SDG indicators [indicator: 15.1.2] and [indicator: 15.4.1] measure the share of Key Biodiversity Areas (KBAs) that are protected to promote terrestrial, freshwater and mountain biodiversity.[footnote: Key Biodiversity Areas (KBAs) are areas that are identified as most important for species and the ecosystems they live in and contribute significantly to biodiversity. See [link: https://www.keybiodiversityareas.org/ Key Biodiversity Areas].] The share of KBAs that are protected has nearly doubled between 2000 and 2021, although the trend has slowed in recent years.
Share of KBAs that are protected has doubled between 2000 and 2021
Share of protected KBAs of total KBAs in the world
Source: BirdLife International (BLI), International Union for Conservation of Nature (IUCN), UN Environment World Conservation Monitoring Centre (UNEP-WCMC); Retrieved from [link: https://unstats.un.org/sdgs/dataportal/database UN Global SDG Indicator Database (15.1.2, 15.4.1)].
COP15 of UN Convention on Biodiversity sets new targets
In December 2022, at the 15th Conference of the Parties (COP) to the UN Convention on Biological Diversity,[footnote: See [link: https://www.cbd.int/ UN Convention on Biological Diversity].] the Kunming-Montreal Global Biodiversity Framework (GBF) was adopted. The GBF includes four long-term goals on improving biodiversity and 23 targets for urgent action to achieve these goals by 2030. The targets include reducing threats to biodiversity, and meeting people’s needs through sustainable means. [footnote: See [link: https://www.cbd.int/article/cop15-final-text-kunming-montreal-gbf-221222 COP15: Final text of Kunming-Montreal Global Biodiversity Framework].] A monitoring framework similar to that for SDGs will be used for the targets.
The targets include a new 30x30 goal to preserve 30 percent of the Earth’s land, oceans, coastal areas and inland waters by 2030, a significant increase from current targets. To achieve these goals, targets also stipulate the reduction of government subsidies that are harmful to biodiversity and increasing funding from wealthier countries to poorer ones.
Learn more about
SDG
15
In the charts below you can find more facts about SDG {activeGoal} targets, which are not covered in this story. The data for these graphics is derived from official UN data sources.
SDG target
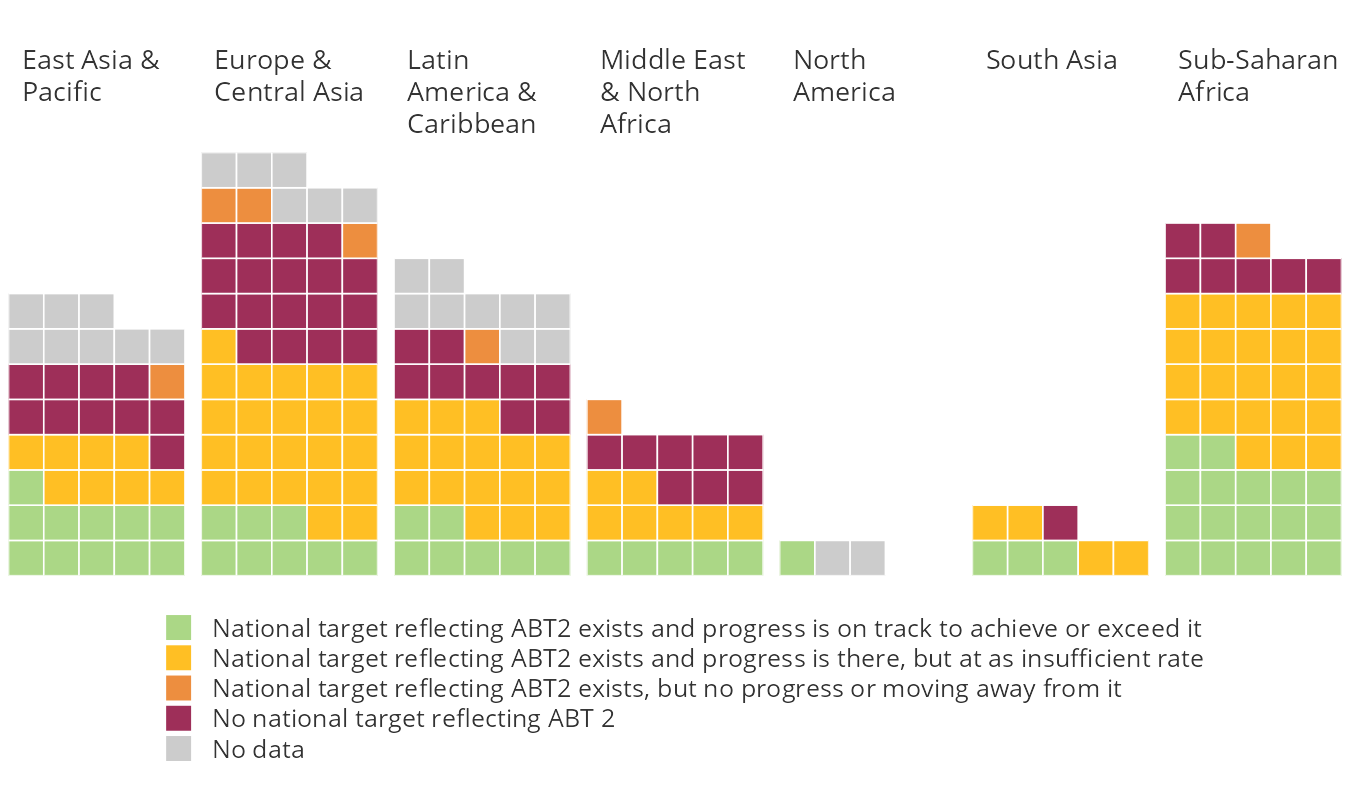
15.9
Many countries have not integrated biodiversity values into strategies for development, poverty reduction strategies and planning processes
Countries that established national targets in accordance with Aichi Biodiversity Target 2 of the Strategic Plan for Biodiversity 2011-2020 in their National Biodiversity Strategy and Action Plans
* Each square represents a country in the respective region.
Source: [link: https://unstats.un.org/sdgs/dataportal/ SDG Global Database]DOWNLOAD
SDG target
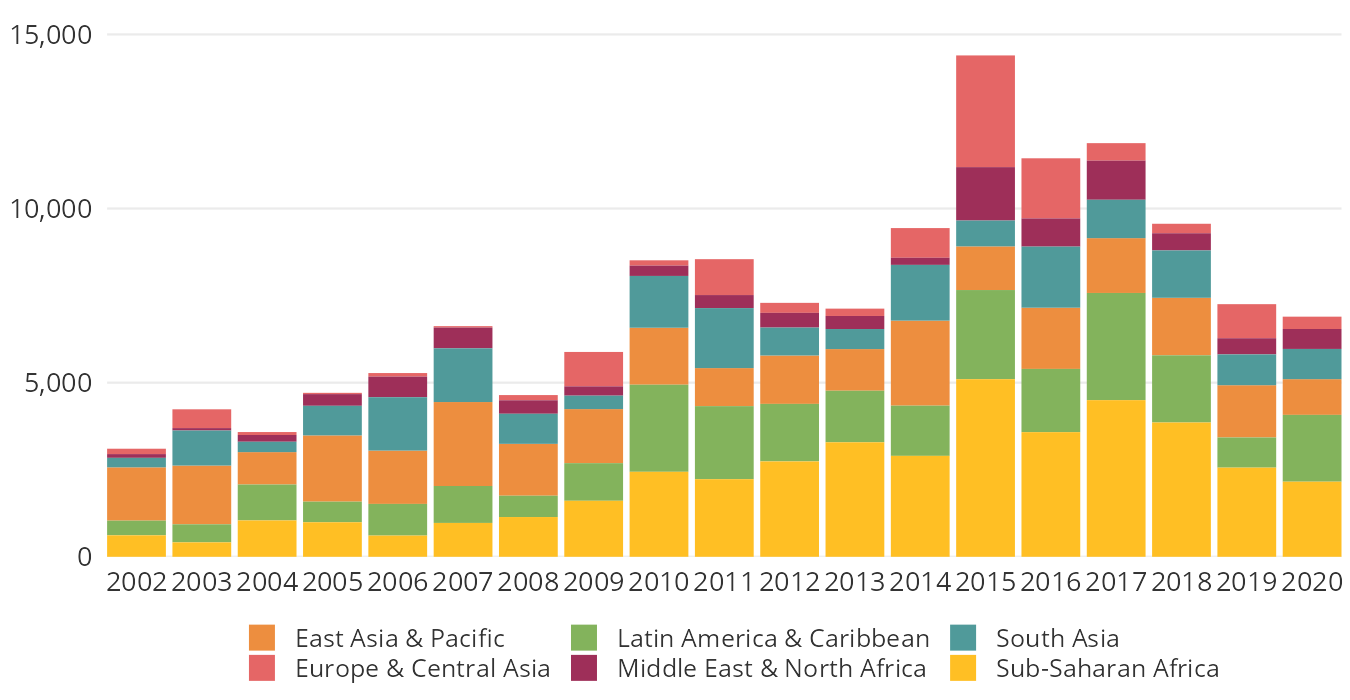
15.a
Official development assistance (ODA) can be used for promoting biodiversity, but levels vary by year and region.
Total official development assistance for biodiversity, by recipient countries (millions of constant 2020 United States dollars)
Source: [link: https://unstats.un.org/sdgs/dataportal/ SDG Global Database]DOWNLOAD