[goal: 2] calls for ending hunger and achieving nutrition security for all through increased access to healthy diets. In 2021, nearly 828 million people were undernourished—close to one in every 10 people across the world. Worldwide, 3.1 billion people are unable to afford a healthy diet, a challenge made worse by global crises like Russia’s invasion of Ukraine.
To sustain an active and healthy life, a person requires a balanced diet with sufficient calories, and an optimal balance of essential nutrients and food groups.[reference: FAO, IFAD, UNICEF, WFP and WHO. 2022. [link: https://doi.org/10.4060/cc0639en The State of Food Security and Nutrition in the World 2022]. Repurposing food and agricultural policies to make healthy diets more affordable. Rome, FAO.] Many people around the world cannot afford enough food to meet their daily energy needs, and for others, healthy diets are too expensive. Food takes a sizable share of their income, leaving them with difficult choices.
Low food intake and unbalanced diets can lead to different forms of child malnutrition (ages 0 to 5) such as stunting, wasting, micronutrient deficiencies, being overweight and obesity, or a combination of those conditions [target: 2.2]. This often leads to adverse health consequences, poor developmental and learning outcomes, as well as lost economic productivity later in life.
Undernourishment and malnutrition are widespread globally and can have lifelong effects on health
Source: Food and Agriculture Organization. Retrieved from World Development Indicators ([link: https://data.worldbank.org/indicator/SN.ITK.DEFC.ZS SN.ITK.DEFC.ZS], [link: https://data.worldbank.org/indicator/SH.STA.WAST.ZS SH.STA.WAST.ZS], [link: https://data.worldbank.org/indicator/SH.STA.STNT.ME.ZS SH.STA.STNT.ME.ZS])
Individuals consistently lacking sufficient calories to meet their daily energy requirements are considered [emphasis: undernourished] [target: 2.1].[reference: Food and Agriculture Organization, 2022. [link: https://www.fao.org/sustainable-development-goals/indicators/211/en/#:~:text=Undernourishment%20means%20that%20a%20person,being%20synonymous%20with%20chronic%20undernourishment Sustainable Development Goals: Indicators].] In 2021, nearly 828 million people in the world were undernourished, that is nine in every 100 people.
Food and nutrition insecurity is experienced across all regions. The share of people who were undernourished in 2020 was highest in Sub-Saharan Africa, where a fifth of the population is undernourished (that is 230 million people), followed by South Asia where about 16 percent were undernourished (that is about 300 million people).[reference: FAO, IFAD, UNICEF, WFP and WHO. 2022. [link: https://doi.org/10.4060/cc0639en The State of Food Security and Nutrition in the World 2022]. Repurposing food and agricultural policies to make healthy diets more affordable. Rome, FAO.] Most countries are burdened by several forms of malnutrition, such as undernutrition, micronutrient deficiencies, and obesity.
The consequences of food and nutrition insecurity, which include stunting, wasting or other forms of malnutrition, are particularly acute for children under age 5 and can have a lifelong impact on their mental and physical capabilities. [emphasis: Stunting] in children, which refers to being too short for their age, is a chronic condition most likely to manifest during the “first 1,000 days” of life, from conception to a child’s second birthday. Globally, one in four children below age 5 are stunted. This amounted to an estimated 149 million children in 2020.[reference: [link: https://www.who.int/publications/i/item/9789240025257 UNICEF/WHO/World Bank Group Joint Child Malnutrition Estimates Key findings of the 2021 edition].] Child stunting is estimated to have increased by an additional 3.6 million cases during the COVID-19 pandemic.[reference: FAO, IFAD, UNICEF, WFP and WHO. 2022. The State of Food Security and Nutrition in the World 2022. [link: https://doi.org/10.4060/cc0639en Repurposing food and agricultural policies to make healthy diets more affordable. Rome, FAO.]]
Stunting is most widespread in Sub-Saharan Africa and South Asia. One third of children in these regions are shorter than normal for their age. Stunting is not reversible[reference: World Health Organization. 2015. [link: https://www.who.int/news/item/19-11-2015-stunting-in-a-nutshell#:~:text=Stunting%20is%20the%20impaired%20growth,WHO%20Child%20Growth%20Standards%20median Stunting in a nutshell].] and can indicate cognitive underdevelopment[reference: World Bank. 2018. [link: https://www.worldbank.org/en/publication/wdr2018 World Development Report: LEARNING to Realize Education’s Promise].] resulting in long-term impacts such as poor school performance, low productivity, and reduced earning potential.[reference: World Health Organization. 2015. [link: https://www.who.int/news/item/19-11-2015-stunting-in-a-nutshell#:~:text=Stunting%20is%20the%20impaired%20growth,WHO%20Child%20Growth%20Standards%20median Stunting in a nutshell].]
[emphasis: Wasting] in children is a life-threatening form of malnutrition defined as having a weight that is too low for the child’s height. Wasting is caused by a sudden extreme weight loss due to insufficient quantity or quality of food and/or acute health conditions. Globally, one in every 15 children under age 5 were wasted, that is 45.4 million children in 2020.[reference: [link: https://www.who.int/publications/i/item/9789240025257 UNICEF/WHO/World Bank Group Joint Child Malnutrition Estimates Key findings of the 2021 edition].] Another 13.6 million children are expected to be affected by wasting due to the COVID-19 pandemic.[reference: FAO, IFAD, UNICEF, WFP and WHO. 2022. [link: https://doi.org/10.4060/cc0639en The State of Food Security and Nutrition in the World 2022]. Repurposing food and agricultural policies to make healthy diets more affordable. Rome, FAO.]
The prevalence of wasting is 15 percent in South Asia, three times the rate of other regions. The uniquely high rate of wasting in South Asia can be attributed to poor maternal health and nutrition. Children who are born to women with poor health, that is women who are underweight and/or short, have higher rates of wasting; and children who are born to women who are undernourished may not get adequate nutrition in-utero and as a result may be born wasted.[reference: Harriet Torlesse and Minh Tram Le. [link: https://www.ennonline.net/fex/63/southasiachildwasting#:~:text=The%20prevalence%20of%20wasting%20in,Ashorn%20et%20al%2C%202018 South Asia and child wasting – unraveling the conundrum]. Field Exchange 63, October 2020. p7.]
Source: Food and Agriculture Organization. Retrieved from World Development Indicators ([link: https://data.worldbank.org/indicator/SN.ITK.DEFC.ZS SN.ITK.DEFC.ZS], [link: https://data.worldbank.org/indicator/SH.STA.WAST.ZS SH.STA.WAST.ZS], [link: https://data.worldbank.org/indicator/SH.STA.STNT.ME.ZS SH.STA.STNT.ME.ZS])
Ending all forms of malnutrition is one of the most urgent and pervasive development-related challenges. Most countries are burdened by several forms of malnutrition, such as undernutrition, micronutrient deficiencies, overweight, obesity and diet-related diseases. The various forms of malnutrition may coexist within the same country, community, household, or person.
Many families cannot afford a healthy diet which can help protect against malnutrition. Stunting and other forms of undernutrition early in life may predispose children to diet-related Non-Communicable Diseases (NCDs) like type 2 diabetes, heart disease and stroke later in life. [target: 3.4]
So, what is a healthy diet?
A healthy diet meets the nutritional standards set by national dietary guidelines, with sufficient diversity and quantity within and between food groups to achieve nutrient adequacy and protect against diet-related diseases.[reference: FAO, IFAD, UNICEF, WFP and WHO. 2020. [link: https://doi.org/10.4060/ca9692en The State of Food Security and Nutrition in the World 2022. Transforming food systems for affordable healthy diets]. Rome, FAO.]
Overall diet choices depend not only on the cost of food items, but also on their availability and on people’s personal and cultural preferences. Many countries publish their own food-based dietary guidelines which promote healthy diets. These account for local preferences and availability of food items. To measure access and affordability, the Food Prices for Nutrition project has computed the cost of a healthy diet meeting nutritional standards set by dietary guidelines, with sufficient diversity and quantity within and between food groups to achieve nutrient adequacy and protect against diet-related diseases using the least expensive locally available items in each food group (fruits; vegetables; starchy staples; animal-source foods; legumes, nuts, and seeds; and oils and fats).
The cost of different types of food varies. Many nutritious foods, such as fresh fruits and vegetables, legumes, nuts, and animal-source foods are unaffordable in some areas; by contrast, energy-dense processed foods and drinks that are high in fat, sugar and/or salt but nutrient-deficient are often cheaper and more readily available.
How much is spent on each food group varies across and within regions. Generally, animal-source foods, vegetables, and fruits are the most expensive. Animal-source foods in Sub-Saharan Africa can vary from 15 percent of the total cost, as in Guinea, to 41 percent, as in the Democratic Republic of Congo. The vegetable cost share in Europe and Central Asia ranges from 11 percent in Belarus to 34 percent in Norway.
Below you can explore the cost share of each food group in a least-cost healthy diet for each country. The total cost in the receipt shows the cheapest option available for consuming a healthy diet in the selected country.
Cost contribution to meet a healthy diet is often lowest for oils and fats and highest for vegetables
Cost of the least expensive locally-available food group needed to meet intake levels recommended in food-based dietary guidelines, in 2017 PPP dollar/person/day. Data available for 2017.
Source: Food and Agriculture Organization and Food Prices for Nutrition. Retrieved from [link: https://databank.worldbank.org/source/food-prices-for-nutrition Food Prices for Nutrition database].
Affordability of a healthy diet
Unfortunately, a healthy diet is out of reach for a large share of the global population. Many cannot even afford the necessary calories for day-to-day subsistence or a diet with an optimal balance of essential nutrients and food groups to avoid negative health consequences.
The Food Prices for Nutrition project identifies three types of diets meeting specific nutrition needs and estimates their costs.[reference: Food Prices for Nutrition project. [link: https://www.worldbank.org/en/programs/icp/brief/foodpricesfornutrition#3 Food Prices for Nutrition DataHub: global statistics on the cost and affordability of healthy diets].]
The three types of diets are:
[emphasis: An energy-sufficient diet]: provides sufficient energy from starchy staples.
[emphasis: A nutrient-adequate diet]: avoids nutrient deficiencies or toxicity.
[emphasis: A healthy diet]: meets the goal of preventing diet-related diseases and enables a healthy and active life.
Food price data from the International Comparison Program (ICP) shows the cost of the cheapest food items in each country meeting the standards set by each of the three diets (using as a reference an active and healthy woman).[reference: World Bank, [link: https://www.worldbank.org/en/programs/icp International Comparison Program].] The costs are adjusted for purchasing power parity which means that all costs are adjusted for the cost of living.
If the cost of a diet is less than 52 percent of a household’s income, this diet is considered affordable to them. The project finds that the cost of these diets varies significantly across countries, as do their affordability. While the costs are not related to the country’s income, affordability has a strong correlation to income levels. These diets become more affordable as income levels increase.
Affordability of a diet depends on cost and income
Cost (PPP $) and affordability (% of country’s population) for energy-sufficient, nutrient-adequate, and healthy diets
Note: The cost of diets accounts for purchasing power differences across countries to allow for cross-country comparisons. [chapterlink: 1 See SDG 1.]DataImageCopy Link
Source: Food and Agriculture Organization and Food Prices for Nutrition. Retrieved from [link: https://databank.worldbank.org/source/food-prices-for-nutrition Food Prices for Nutrition database].
How do the cost and affordability of different types of diets relate to a country’s income level? Here, countries with 2017 data available are sorted by their GDP per capita (in 2017 [link: https://www.worldbank.org/en/programs/icp/brief/VC_Uses purchasing-power adjusted dollars]) and are colored by income level.
The most basic diet to avoid hunger is a [emphasis: energy-sufficient diet] which provides only sufficient energy for day-to-day subsistence. Its cost at a country level is determined by using the cheapest starchy staple available in quantities sufficient for subsistence using as reference an adult woman requiring 2,330 calories a day.[footnote: An adult woman of reproductive age is used as reference because their diet requirements fall at the median level of the entire population distribution and are therefore representative of the population and because they are a nutritionally vulnerable group] Globally, an energy-sufficient diet costs 83 cents a day. Adjusting for the cost of living, an energy-sufficient diet costs roughly the same in the United States ($0.90) and in Tanzania ($1).
However, less than 1 percent of the population in the United States lack the resources for an energy-sufficient diet – in sharp contrast with 44 percent of the population of Tanzania. An estimated [emphasis: 5.4 percent of the global population], that is 381 million people, are unable to afford this type of diet.[reference: Herforth, A., Bai, Y., Venkat, A., Mahrt, K., Ebel, A. & Masters, W.A. 2020. [link: https://doi.org/10.4060/cb2431en Cost and affordability of healthy diets across and within countries. Background paper for The State of Food Security and Nutrition in the World 2020]. FAO Agricultural Development Economics Technical Study No. 9. Rome, FAO.] Those who cannot afford an energy-sufficient diet are concentrated in low-income countries.
An energy-sufficient diet only meets the caloric needs for daily survival. While such a diet may maintain short-term subsistence, it can have long-term negative consequences for health and well-being.[reference: Herforth, A., Bai, Y., Venkat, A., Mahrt, K., Ebel, A. & Masters, W.A. 2020. [link: https://doi.org/10.4060/cb2431en Cost and affordability of healthy diets across and within countries. Background paper for The State of Food Security and Nutrition in the World 2020]. FAO Agricultural Development Economics Technical Study No. 9. Rome, FAO.]
A [emphasis: nutrient-adequate diet] provides sufficient calories and also meets a body’s essential nutrient requirements of carbohydrates, protein, fat, vitamins, and minerals. The cost of a nutrient-adequate diet is calculated by summing up the least expensive set of food items in a country which meet basic energy and consumption requirements of 23 essential macro- and micro-nutrients.[reference: Herforth, A., Bai, Y., Venkat, A., Mahrt, K., Ebel, A. & Masters, W.A. 2020. [link: https://doi.org/10.4060/cb2431en Cost and affordability of healthy diets across and within countries. Background paper for The State of Food Security and Nutrition in the World 2020]. FAO Agricultural Development Economics Technical Study No. 9. Rome, FAO.]
The global average cost of a nutrient-adequate diet is $2.46 per day, nearly three times that of an energy-sufficient diet.[reference: Herforth, A., Bai, Y., Venkat, A., Mahrt, K., Ebel, A. & Masters, W.A. 2020. [link: https://doi.org/10.4060/cb2431en Cost and affordability of healthy diets across and within countries. Background paper for The State of Food Security and Nutrition in the World 2020]. FAO Agricultural Development Economics Technical Study No. 9. Rome, FAO.] A nutrient-adequate diet costs $1.94 in Tanzania, slightly lower than in the United States ($2.22).
While 1.5 percent of the United States population lacks the means for a nutrient-adequate diet, nearly 80 percent of the Tanzanian population cannot afford it. Unsurprisingly, because of the higher cost, this type of diet is unaffordable for [emphasis: three in every 10 people], some 2.2 billion people globally.[reference: Herforth, A., Bai, Y., Venkat, A., Mahrt, K., Ebel, A. & Masters, W.A. 2020. [link: https://doi.org/10.4060/cb2431en Cost and affordability of healthy diets across and within countries. Background paper for The State of Food Security and Nutrition in the World 2020]. FAO Agricultural Development Economics Technical Study No. 9. Rome, FAO.]
The nutrient-adequate diet is unaffordable to more than three-quarters of the population in low income countries and more than half in lower-middle income countries. In high income countries, less than 1 percent cannot afford a nutrient-adequate diet. While a nutrient-adequate diet provides all required nutrients, it does not ensure balance within and across food groups.
A [emphasis: healthy diet] goes further to meet a set of dietary recommendations, provides proper balance, and is designed to meet cultural food preferences. It is protective of long-term health and can help prevent malnutrition in all its forms.[reference: Herforth, A., Bai, Y., Venkat, A., Mahrt, K., Ebel, A. & Masters, W.A. 2020. [link: https://doi.org/10.4060/cb2431en Cost and affordability of healthy diets across and within countries. Background paper for The State of Food Security and Nutrition in the World 2020]. FAO Agricultural Development Economics Technical Study No. 9. Rome, FAO.] Healthy diets are more expensive, as expected, costing an average of $3.31 per day, or 1.3 times the cost of a nutrient-adequate diet and nearly four times that of a calorie-sufficient diet.
The cost of a healthy diet in the United States ($3.23) is more expensive than in Tanzania ($2.60).
However, while only 2 percent of all Americans cannot afford a healthy diet, this diet is beyond the means of nearly 90 percent of Tanzanians. In low income countries, 90 percent of the population cannot afford a healthy diet. In lower-middle income countries, this figure is more than 70 percent, and 16 percent in upper-middle income countries. This diet is unaffordable for less than 2 percent in high income countries. Globally, 3.1 billion people don’t have access to a healthy diet. This number has risen by 112 million during the pandemic.
Source: Food and Agriculture Organization and Food Prices for Nutrition. Retrieved from [link: https://databank.worldbank.org/source/food-prices-for-nutrition Food Prices for Nutrition database].
People who cannot afford a healthy diet
40%people
Globally
Countries can only fulfill [target: 2.1] of making nutritious food available for all and [target: 2.2] to end malnutrition if healthy food is more affordable.
The affordability of unhealthy and over-consumed foods like sugar compared to healthier items like fruits and vegetables can be attributed in part to the unintended consequences of support policies in the food and agriculture sector.[reference: FAO, IFAD, UNICEF, WFP and WHO. 2022. [link: https://doi.org/10.4060/cc0639en The State of Food Security and Nutrition in the World 2022]. Repurposing food and agricultural policies to make healthy diets more affordable. Rome, FAO.] Poorly targeted support can lead to distortions in trade, production, and consumption, and encourage unhealthy diets.
There are opportunities to redirect current agricultural support to promote healthy diets that are accessible and affordable for all. Repurposing agricultural subsidies, for example, particularly from producers to consumers, has the potential to play an important role in delivering healthy diets at lower costs and making them more affordable.[reference: Gautam, Madhur; Laborde, David; Mamun, Abdullah; Martin, Will; Pineiro, Valeria; Vos, Rob. 2022. [link: http://hdl.handle.net/10986/36875 Repurposing Agricultural Policies and Support: Options to Transform Agriculture and Food Systems to Better Serve the Health of People, Economies, and the Planet.] World Bank, Washington, DC.]
Increase affordability for
3million people
Globally
This shift in support towards nutritious foods can lower the cost of healthy diets by 3.3 percent and increase affordability for 3 million more people, while reducing undernourishment.[reference: FAO, IFAD, UNICEF, WFP and WHO. 2022. [link: https://doi.org/10.4060/cc0639en The State of Food Security and Nutrition in the World 2022]. Repurposing food and agricultural policies to make healthy diets more affordable. Rome, FAO.]
How has a regional conflict impacted global food prices?
Global food prices in 2022, in terms of the food price index, were higher than they had been since 1990.[footnote: The food price index developed by the Food and Agriculture Organization is a measure of the cost of purchasing food. It is calculated by computing an average of the monthly changes in international food prices of five food groups (Cereals, Vegetable Oils, Dairy, Meat and Sugar).[reference: Food and Agriculture Organization, 2022. [link: https://www.fao.org/worldfoodsituation/foodpricesindex/en/ Food Price Index.]]]
Within two years, from 2020 to 2022, the cost of purchasing food increased by [emphasis: 50 percent].
In fact, in 2022, inflation in food prices was double (nearly 12 percent) that of non-food and non-energy commodities (6 percent).[reference: Ha, Jongrim, M. Ayhan Kose, and Franziska Ohnsorge (2021). [link: https://www.worldbank.org/en/research/brief/inflation-database One-Stop Source: A Global Database of Inflation]. Policy Research Working Paper 9737. World Bank, Washington DC.] This sharp rise in food prices is due to a confluence of factors including the disrupted food supply chains during the COVID-19 pandemic, climate change events impacting agricultural productivity, and internal and international conflicts which have disrupted production and distorted trade policies [target: 16.1]. In 2022, Russia’s invasion of Ukraine exacerbated the shock in global food prices.
Ukraine and Russia are the fourth and sixth largest exporters of cereals, respectively. Russia is the world’s largest wheat exporter (14 percent of global trade value) and Ukraine is the third largest for maize (12 percent of global trade value). They are among the most important sellers to countries in the Middle East & North Africa and the largest cereal exporters to Egypt and Türkiye. In addition to cereal, they are also major exporters of vegetable oils, seed oils, animal fats, and fertilizers.[reference: Food and Agriculture Organization, 2022. [link: https://www.fao.org/3/cb9236en/cb9236en.pdf The importance of Ukraine and the Russian Federation for global agricultural markets and the risks associated with the current conflict]. Information Note.]
Shortly after Russia’s invasion, agriculture and food production collapsed in Ukraine. In addition, many countries imposed economic sanctions on Russia, limiting its food exports. These disruptions altered the food trade market so significantly that, even a year after the invasion, current food prices remained at an all-time high.[reference: World Bank, 2023. [link: https://www.worldbank.org/en/topic/agriculture/brief/food-security-update Food Security Update.]]
Ukraine’s food exports halved after Russia’s invasion
Ukraine’s food exports over time (trade value in US dollars)
Source: [link: https://comtrade.un.org/data UN Comtrade Database]
The February 2022 invasion had a devastating impact on Ukraine’s food exports. In the year before the conflict, between March and May of 2021, Ukraine exported food was worth $5.2 billion.
In the same months in 2022, right after the invasion began, Ukraine’s food export value fell to $2.8 billion, half of its 2021 value. Data for Russia’s food exports is not available at this time.
The dramatic fall in Ukraine’s food exports impacted many products. Cereal exports in particular plummeted, dropping to a third of their value in the preceding year.
Source: [link: https://comtrade.un.org/data UN Comtrade Database]
Several countries were directly impacted by the conflict because they normally import large quantities of food from Ukraine.
The crisis in Ukraine impacted food imports globally
Food imports from Ukraine for cereals and oils and fats (in trade value, million US dollars)
Source: [link: https://comtrade.un.org/data UN Comtrade Database]
Many countries in South Asia, Middle East & North Africa, and Europe depend heavily on Ukraine for cereal imports. Two-thirds of Pakistan’s cereal comes from Ukraine, Indonesia’s and Tunisia’s are close to half, and Türkiye’s is about a third. However, since the conflict, imports from Ukraine fell sharply, reducing the overall amount of cereal available.
Similar patterns were observed for other crucial products exported by Ukraine such as oils and animal fats. Some of Ukraine’s largest importers of oils and fats have been Türkiye, India, and the European Union.
Source: [link: https://comtrade.un.org/data UN Comtrade Database]
In response to the tighter food supply, many countries placed restrictions on exports in order to keep more food for domestic demand. For example, Indonesia banned the export of palm oil in April 2022, cutting the global export market for the product by more than half. Argentina, which accounts for two-fifths of all processed soy exports in the world, banned its export in March 2022. Many of these bans lasted a few months but others are still in place.[reference: World Bank, 2023. [link: https://www.worldbank.org/en/topic/agriculture/brief/food-security-update Food Security Update.]]
With global food shortages after Russia’s invasion of Ukraine, many countries placed food export restrictions
Food export restrictions placed by countries since January 2022 (expressed in total kcal exported)
Source: International Food Policy Research Institute (IFPRI), 2022. [link: https://www.ifpri.org/project/covid-19-food-trade-policy-tracker COVID-19 food trade policy tracker].
As a result of disruptions in the global food supply, the impact was felt, not only in countries importing food from Ukraine, but also in most countries that heavily rely on any food imports.
For example, close to three-fourths of all food imports were disrupted in countries like Tajikistan and Uzbekistan in Central Asia. About a third of imports in many Middle East and North African countries was also impacted due to food export restrictions. With these restrictions in place, a total of 3,000 trillion calories worth of food were restricted from trade due to the export bans in 2022. That is roughly the amount of calories consumed globally over 160 days.
This regional conflict has had a severe global impact: the invasion has had ramifications not only for products exported by Ukraine and Russia, but for all types of food globally. Many countries formed bilateral or multilateral agreements to continue food trade among themselves to contain inflation and help manage the short-term volatility of food prices.[reference: Glauber, Joseph, and David Laborde. 2022. [link: https://www.ifpri.org/blog/russia-ukraine-grain-agreement-what-stake The Russia-Ukraine grain agreement: What is at stake?]. IFPRI Blog Post. International Food Policy Research Institute] With the help of the Black Sea Grain Initiative, food exports from Ukraine and Russia resumed in July 2022 providing some relief from the crisis.[reference: UN News, 2022. [link: https://news.un.org/en/story/2022/10/1129757 Ukraine: UN-led Grain Initiative helps anchor food supply, chart way out of crisis]]
However, even before Russia’s invasion of Ukraine, a healthy diet was unaffordable for 40 percent of the global population, or roughly 3 billion people. And rising food prices and the lingering effects of the pandemic further highlighted fragilities in the agrifood systems resulting in increased food insecurity and malnutrition. Thus, rising global food prices and the growing unaffordability of a healthy diet can further delay the ability to reach the goal of ending hunger and improving nutrition for all.
Learn more about
SDG
2
In the charts below you can find more facts about SDG {activeGoal} targets, which are not covered in this story. The data for these graphics is derived from official UN data sources.
SDG target
2.4
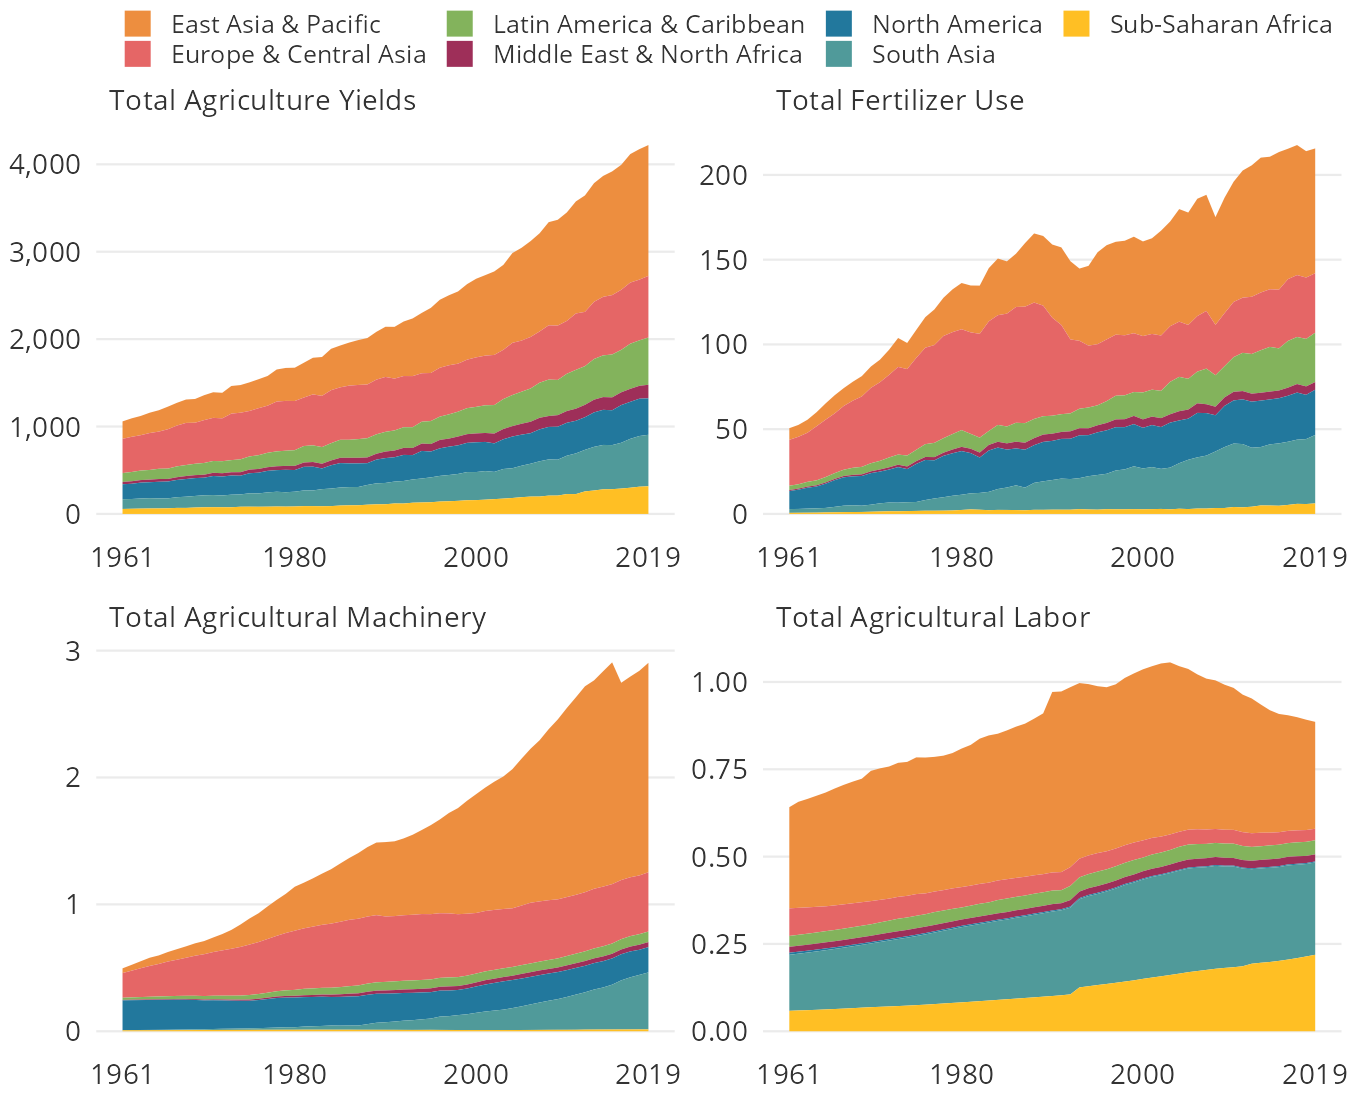
Agricultural yields have risen over time with increased fertilizer and machinery use. Total agricultural labor has been falling since 2000.
Total agriculture yields, fertilizer use, machinery and labor in millions by region, 1961-2019
* Total yields measured in $1000, constant 2015 prices. Fertilizer measured in metric tons of inorganic N,P,K and organic. Machinery is measured in 1000 metric horsepower (CV). Labor is measured as 1000 persons economically active in agriculture.
Source: [link: https://www.ers.usda.gov/data-products/international-agricultural-productivity/ USDA Economic Research Service].DOWNLOAD
SDG target
2.b.1
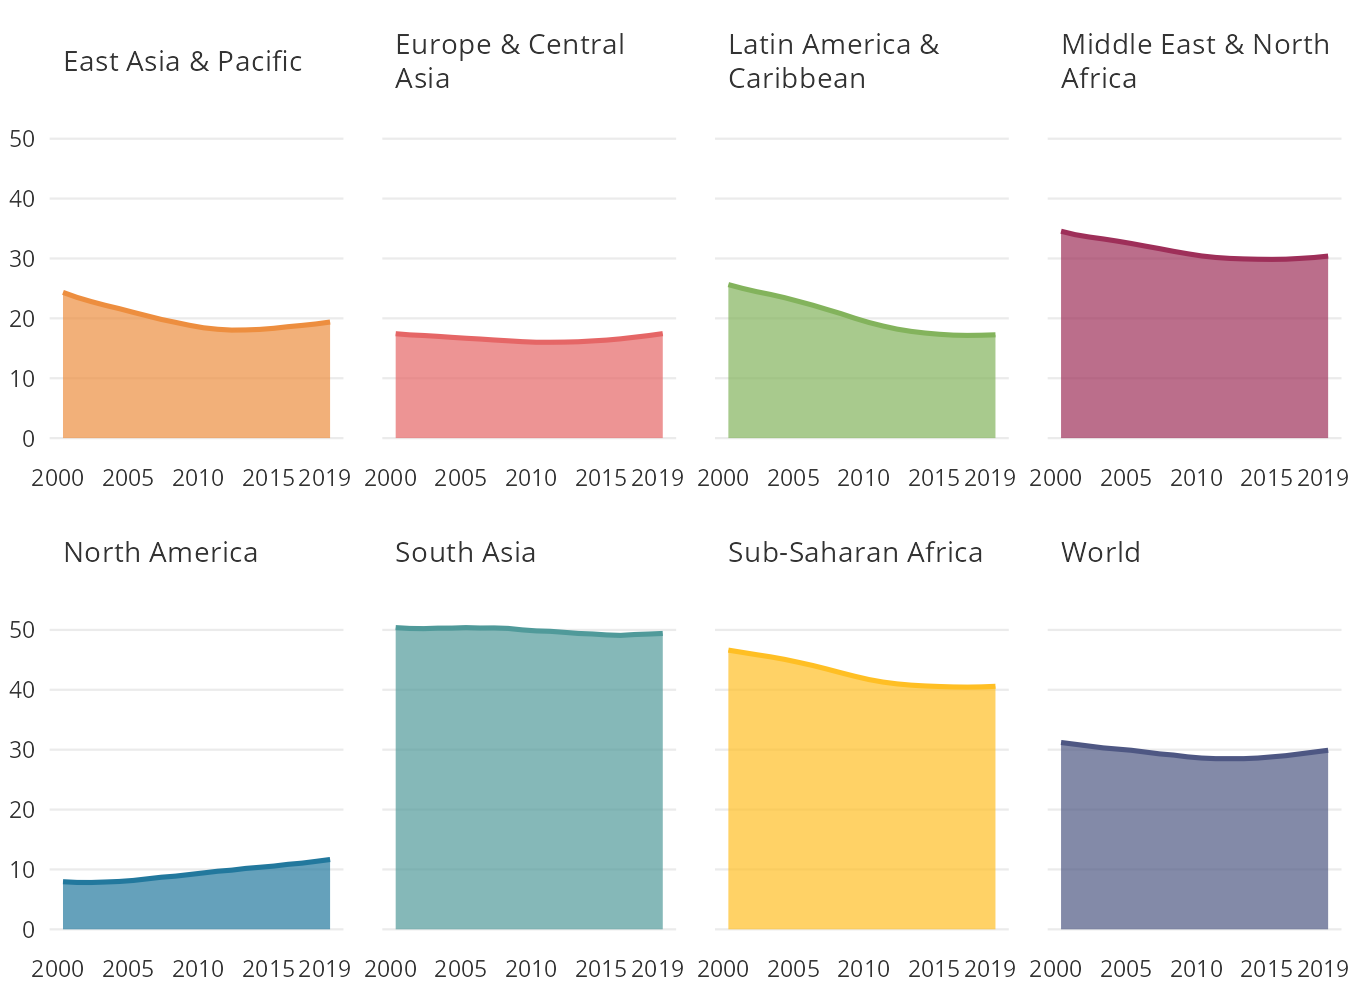
Anemia among women of reproductive age has slightly increased in recent years.
Prevalence of anemia among women of reproductive age, 2000-2019 (% of women ages 15-49)
Source: World Health Organization. Retrieved from World Development Indicators ([link: https://data.worldbank.org/indicator/SH.ANM.ALLW.ZS SH.ANM.ALLW.ZS]).DOWNLOAD