Access to universal and sustainable electricity: Meeting the challenge
Worldwide
[goal: 7] aims to ensure access to affordable, reliable, and sustainable energy for all. On average, 91 percent of people across the world had access to electricity in 2021—but in some countries the access rate was as low as 19 percent. Increased electricity access, however, has come with higher greenhouse emissions.
Under [goal: 7], countries face the often conflicting challenge of bringing electricity to all, [target: 7.1], and at the same time increasing the proportion generated using renewable sources to reduce greenhouse gas emissions, [target: 7.2]. Both targets must be addressed simultaneously by 2030.
Global access to electricity is increasing at a slow pace
South Asia drove most of the gains in the last two decades, rising from 58 percent in 2000 to 99 percent in 2021.
Sub-Saharan Africa has also made progress, with electricity access rising from 26 percent in 2000 to 51 percent in 2021. One out of two people in Sub-Saharan Africa lacked access to electricity in 2021, and access in this region would need to more than double by 2030 to meet [target: 7.1].
Uneven gains in access to electricity
Proportion of population with access to electricity
Source: World Bank Global Electrification Database from [link: https://trackingsdg7.esmap.org/ Tracking SDG 7: The Energy Progress Report] led jointly by the custodian agencies: the International Energy Agency (IEA), the International Renewable Energy Agency (IRENA), the United Nations Statistics Division (UNSD), the World Bank and the World Health Organization (WHO). Retrieved from World Development Indicators ([link: https://data.worldbank.org/indicator/EG.ELC.ACCS.ZS EG.ELC.ACCS.ZS]).
The urban-rural gap in access to electricity is still significant
Closing the urban-rural gap in low- and lower-middle-income countries, particularly in Sub-Saharan Africa, is key to achieving [target: 7.1].
Rural areas contain
80%
of the world’s population without electricity
There is a stark divide in global access to electricity between urban and rural areas. In 2021, [emphasis: 675 million people] worldwide lacked access to electricity. Around 80 percent of those lived in rural areas.[footnote: 43 percent of the global population lived in rural areas in 2021.]
This is most evident in Sub-Saharan Africa, where almost 60 percent of people live in rural communities. In this region, the proportion of residents with electricity was 30 percent in rural areas compared to 81 percent in urban areas in 2021. Overall, in Sub-Saharan Africa, approximately 478 million rural residents lack access to electricity.
Most people lacking access to electricity live in rural Sub-Saharan Africa
Population without access to electricity (millions of people)
Source: World Bank Global Electrification Database from [link: https://trackingsdg7.esmap.org/ Tracking SDG 7: The Energy Progress Report] led jointly by the custodian agencies: the International Energy Agency (IEA), the International Renewable Energy Agency (IRENA), the United Nations Statistics Division (UNSD), the World Bank and the World Health Organization (WHO). Retrieved from World Development Indicators ([link: https://data.worldbank.org/indicator/EG.ELC.ACCS.UR.ZS EG.ELC.ACCS.UR.ZS], [link: https://data.worldbank.org/indicator/EG.ELC.ACCS.RU.ZS EG.ELC.ACCS.RU.ZS], [link: https://data.worldbank.org/indicator/SP.URB.TOTL SP.URB.TOTL], [link: https://data.worldbank.org/indicator/SP.RUR.TOTL SP.RUR.TOTL]).
Visualizing access to electricity through nighttime lights
One way to visualize access to electricity is through nighttime lights captured by satellite images. This can be a useful complementary tool to fill the gaps from household survey data, the typical source for measuring electricity access, collected once every few years.[footnote: The World Bank’s [link: https://registry.opendata.aws/wb-light-every-night/ Light Every Night] data repository may be a useful data source for nighttime light satellite imagery.]
Despite its large population, a single region stands out for having the fewest lights visible at nighttime: Sub-Saharan Africa. Nighttime lights can help visualize the current state of electrification in this region.
Low intensity of nighttime lights can help identify populated areas with limited access to electricity
The distribution of population and nighttime lights
Source: Nighttime lights: [link: https://blackmarble.gsfc.nasa.gov/ NASA’s Black Marble]. Earth at Night. NASA Earth Observatory 2016. Population: [link: https://www.worldpop.org/ WorldPop] and Center for International Earth Science Information Network (CIESIN), Columbia University. 2018. [link: https://dx.doi.org/10.5258/SOTON/WP00647 Global High Resolution Population Denominators Project] - Funded by The Bill and Melinda Gates Foundation (OPP1134076).
By analyzing the distribution of nighttime lights and populated areas, we can get an idea of where people without access to electricity live.
Population is shown in blue. Lighter blue shades represent higher population density using census counts.
Nighttime lights are shown in yellow. Brighter yellow shades represent a higher intensity of nighttime lights.
In the eastern Mediterranean, nighttime lights can be found in most populated areas.
In South Asia, where the electricity sector has developed rapidly over the last decade, nighttime lights can also be found in most urban and rural populated areas.
In Sub-Saharan Africa, nighttime lights are mostly concentrated in urban areas and do not always overlap the distribution of populated areas.
Around Lake Victoria, bordered by Kenya, Uganda, and Tanzania, millions of people live without power. These are some of the most densely-populated rural areas in the world, but nighttime lights are mostly concentrated in urban areas such as Kampala, Kisumu, and Mwanza.
In Nigeria, access to electricity is concentrated in the south and it is sparse in the north. Nighttime lights show a broad presence along the coast. In the north, lights are mostly limited to state capitals and industrial regions.[reference: Alabi, Oluwafisayo, Aisha Abubakar, Astrid Werkmeister, and Suki Dauda Sule. 2023. [link: https://doi.org/10.1007/s10708-022-10689-2 "Keeping the lights On or Off: Tracking the progress of access to electricity for sustainable development in Nigeria."] GeoJournal 88 (2): 1535--1558.]
In Ethiopia, nighttime lights are heavily concentrated in Addis Ababa. Nighttime lights in rural areas have particularly low intensity. According to survey data, close to 80 percent of Ethiopia’s 112 million people live in rural areas.
You may now explore the distribution of populated areas and nighttime lights yourself. Click the map and then use the "+" and "-" keys to zoom (or double click), and use the arrow keys or drag the map to scroll around in any direction.
Source: Nighttime lights: [link: https://blackmarble.gsfc.nasa.gov/ NASA’s Black Marble]. Earth at Night. NASA Earth Observatory 2016. Population: [link: https://www.worldpop.org/ WorldPop] and Center for International Earth Science Information Network (CIESIN), Columbia University. 2018. [link: https://dx.doi.org/10.5258/SOTON/WP00647 Global High Resolution Population Denominators Project] - Funded by The Bill and Melinda Gates Foundation (OPP1134076).
Measuring different levels of electricity access
[target: 7.1] sets the goal to achieve universal access to electricity, and also to make it reliable. Having an electricity connection is not always a complete indication of the level of access for households. Their level of access also depends on what kind of appliances they can use, how much electricity they can afford, or how often they experience outages.
One of the attributes used to characterize access to electricity is whether it has enough capacity to power certain appliances. Tier 0 represents no access or minimal access. Tier 1 or 2 access (with a daily capacity of 4 hours) may provide a household with essential lighting and power small appliances. However, it is not enough to operate a refrigerator. Tiers 3, 4, and 5 provide higher levels of access (for 8 hours, 16 hours, and 23 hours, respectively) with less interrupted service and the capacity to power high-load appliances. A Tier 5 daily capacity can power air conditioning, a heater, a microwave, a refrigerator, or a washing machine.
Availability and capacity are some of the attributes used to define the tiers of electricity access
For example, the results from the [link: http://hdl.handle.net/10986/30102 MTF in Ethiopia] indicate that most rural households are in Tier 0 (73 percent) and most urban households are in Tier 3 (50.5 percent) or Tier 4 (21.1 percent).
Lower tier electricity access is concentrated in rural areas
Share of households (rural/urban) by level of tier of electricity access
Moving into higher tiers of electricity access will depend on the affordability and availability of grid and off-grid sources. This may come at a higher cost and generate more greenhouse gases unless growth comes from renewable sources. This highlights the dual challenge of achieving universal access to electricity without undermining efforts to reduce greenhouse gas emissions.
Higher access to electricity has come with an increase in greenhouse gas emissions
In the past, progress in access to electricity has driven up greenhouse gas emissions. The rapid expansion of access to electricity in South Asia, for example, has fueled an increase in emissions from the electricity and heat sector. This is because much of this expansion was driven by electricity generated from fossil fuels (coal, natural gas, oil). [target: 7.2] seeks to reverse this trend and increase the use of renewables.
With improved electricity access, greenhouse gas emissions have increased
Greenhouse gas emissions per capita from electricity and heat sector vs. Proportion of population with access to electricity
Source: [link: https://www.climatewatchdata.org/ghg-emissions?breakBy=regions&calculation=PER_CAPITA&end_year=2020®ions=EAP%2CECA%2CLAC%2CMNA%2CNAR%2CSAR%2CWORLD%2CSSA§ors=electricity-heat&source=Climate%20Watch&start_year=1990 Climate Watch Historical GHG emissions from electricity and heat sector]. 2022. Washington, DC: World Resources Institute. World Bank Global Electrification Database from [link: https://trackingsdg7.esmap.org/ Tracking SDG 7: The Energy Progress Report] led jointly by the custodian agencies: the International Energy Agency (IEA), the International Renewable Energy Agency (IRENA), the United Nations Statistics Division (UNSD), the World Bank and the World Health Organization (WHO). Retrieved from World Development Indicators ([link: https://data.worldbank.org/indicator/EG.ELC.ACCS.ZS EG.ELC.ACCS.ZS]).
Between 2000 and 2020, the worldwide proportion of population with access to electricity rose from 78 to 90 percent. Over the same period, greenhouse gas emissions [emphasis: from the electricity and heat sector] rose from 1.7 to 1.9 tons per capita.
East Asia & Pacific and Middle East & North Africa are approaching full access to electricity, but at the same time they are increasing their greenhouse gas emissions per capita. Latin America is also evolving towards universal access to electricity, but with significantly lower emissions per capita due to its higher reliance on hydropower compared to other regions.[reference: IEA. 2021. [link: https://www.iea.org/reports/climate-impacts-on-latin-american-hydropower Climate Impacts on Latin American Hydropower]. IEA. Paris. License: CC BY 4.0.]
North America and Europe & Central Asia have already achieved full access to electricity and have the highest emissions per capita, although these are declining.
South Asia has made progress increasing access to electricity. Emissions per capita have also increased, but remain at a low level compared to other regions.
Sub-Saharan Africa has the lowest greenhouse gas emissions per capita. However, while all other regions have reached near universal electricity access, Sub-Saharan Africa remains far from achieving this goal.
Source: [link: https://www.climatewatchdata.org/ghg-emissions?breakBy=regions&calculation=PER_CAPITA&end_year=2020®ions=EAP%2CECA%2CLAC%2CMNA%2CNAR%2CSAR%2CWORLD%2CSSA§ors=electricity-heat&source=Climate%20Watch&start_year=1990 Climate Watch Historical GHG emissions from electricity and heat sector]. 2022. Washington, DC: World Resources Institute. World Bank Global Electrification Database from [link: https://trackingsdg7.esmap.org/ Tracking SDG 7: The Energy Progress Report] led jointly by the custodian agencies: the International Energy Agency (IEA), the International Renewable Energy Agency (IRENA), the United Nations Statistics Division (UNSD), the World Bank and the World Health Organization (WHO). Retrieved from World Development Indicators ([link: https://data.worldbank.org/indicator/EG.ELC.ACCS.ZS EG.ELC.ACCS.ZS]).
How fast are countries transitioning to renewables?
Renewable energy has the potential to scale up to close the electricity access gap in regions that lack universal access and to prevent further growth of greenhouse gas emissions.
In 2021, around [emphasis: 60 percent] of electricity worldwide was generated from fossil fuels, around [emphasis: 10 percent] came from nuclear power, and the remaining [emphasis: 30 percent] came from renewable sources.[reference: IRENA. 2023. [link: https://www.irena.org/Publications/2023/Jul/Renewable-energy-statistics-2023 Renewable Energy Statistics 2023]. International Renewable Energy Agency (IRENA). Abu Dhabi.]
Source: IRENA. 2023. [link: https://www.irena.org/Publications/2023/Jul/Renewable-energy-statistics-2023 Renewable Energy Statistics 2023]. International Renewable Energy Agency (IRENA). Abu Dhabi.
[emphasis: High-income countries] like the United States, Germany, and Japan have universal access to electricity. However, they face the challenge of transitioning to renewable sources to reduce emissions while maintaining access and quality of service. Many of these countries are turning more to wind and solar to generate electricity. Today, around 10 percent of the world’s electricity is generated from wind and solar power.[reference: IRENA. 2023. [link: https://www.irena.org/Publications/2023/Jul/Renewable-energy-statistics-2023 Renewable Energy Statistics 2023]. International Renewable Energy Agency (IRENA). Abu Dhabi.]
Source: IRENA. 2023. [link: https://www.irena.org/Publications/2023/Jul/Renewable-energy-statistics-2023 Renewable Energy Statistics 2023]. International Renewable Energy Agency (IRENA). Abu Dhabi.
Brazil, India, and China are [emphasis: middle-income countries] where the shares of wind and solar out of total electricity generation are low but increasing. The growth of renewables is happening as the power sector continues to grow. China leads the world as the largest producer of both solar and wind energy. Still, 60 percent of Chinese power generation is sourced from coal and new coal power plants continue to be built.[reference: IEA. 2021. [link: https://www.iea.org/reports/an-energy-sector-roadmap-to-carbon-neutrality-in-china An energy sector roadmap to carbon neutrality in China]. IEA, Paris. License: CC BY 4.0.] In India, coal accounts for close to 70 percent of power generation.[reference: IEA. 2021. [link: https://www.iea.org/reports/india-energy-outlook-2021 India Energy Outlook 2021]. IEA, Paris. License: CC BY 4.0.] At the moment, the largest wind farm in the world is Gansu Wind Farm in China’s Gansu province, and the world’s largest solar power plant is Bhadla Solar Park in Rajasthan, India.
Middle-income countries with a growing electricity sector
Source: IRENA. 2023. [link: https://www.irena.org/Publications/2023/Jul/Renewable-energy-statistics-2023 Renewable Energy Statistics 2023]. International Renewable Energy Agency (IRENA). Abu Dhabi.
In [emphasis: low-income countries] without universal access to electricity, renewable sources have the potential to provide expanded access. Instead of following the typical path of investing in fossil fuels and then transitioning to renewables, low-income countries could move straight away to cleaner energy.
Low-income countries that could directly adopt renewable sources
Source: IRENA. 2023. [link: https://www.irena.org/Publications/2023/Jul/Renewable-energy-statistics-2023 Renewable Energy Statistics 2023]. International Renewable Energy Agency (IRENA). Abu Dhabi.
Sub-Saharan Africa has the potential to develop renewable energy if the costs are low enough. This could be possible as renewable power is becoming more affordable.[reference: IRENA. 2022. [link: https://www.irena.org/Publications/2023/Aug/Renewable-Power-Generation-Costs-in-2022 Renewable Power Generation Costs in 2022]. International Renewable Energy Agency (IRENA). Abu Dhabi.] Solar and wind are promising renewable energy sources and advances are being made to make these technologies better and cheaper.[reference: IEA. 2022. [link: https://www.iea.org/reports/world-energy-outlook-2022 World Energy Outlook 2022]. IEA, Paris. License: CC BY 4.0 (report); CC BY NC SA 4.0 (Annex A).]
Hydropower is a clean and flexible way of generating electricity and can help reduce our dependence on fossil fuels.[reference: IEA. 2021. [link: https://www.iea.org/reports/hydropower-special-market-report Hydropower Special Market Report]. IEA, Paris. License: CC BY 4.0.] However, the potential impact of climate change on surface water flows should be considered when planning hydropower projects.[reference: Wasti, Asphota, Patrick Ray, Sungwook Wi, Christine Folch, María Ubierna, and Pravin Karki. 2022. [link: https://wires.onlinelibrary.wiley.com/doi/abs/10.1002/wcc.757 "Climate change and the hydropower sector: A global review."] WIREs Climate Change 13 (2): e757.]
It is possible to expand access to electricity without a rapid increase in greenhouse gas emissions by relying more on renewable power. Tools such as the [link: https://electrifynow.energydata.info Global Electrification Platform], the [link: https://globalsolaratlas.info/map Global Solar Atlas], the [link: https://globalwindatlas.info Global Wind Atlas], the [link: https://rise.esmap.org/ RISE platform], and the [link: https://rezoning.energydata.info/ Renewable Energy Zoning Tool] help us identify the areas of the world with the most potential for renewable energy development.
The conditions to produce wind and solar power vary during the day and depending on the weather. As the world seeks to transition to renewables, it is still often required to use non-renewable energy sources. Investing in better storage options for renewable energy will be critical to rely more on renewable power in the future.[reference: MIT Energy Initiative. 2022. [link: https://energy.mit.edu/research/future-of-energy-storage/ The future of energy storage. An Interdisciplinary MIT Study.] Massachusetts Institute of Technology.]
Learn more about
SDG
7
In the charts below you can find more facts about SDG {activeGoal} targets, which are not covered in this story. The data for these graphics is derived from official UN data sources.
SDG target
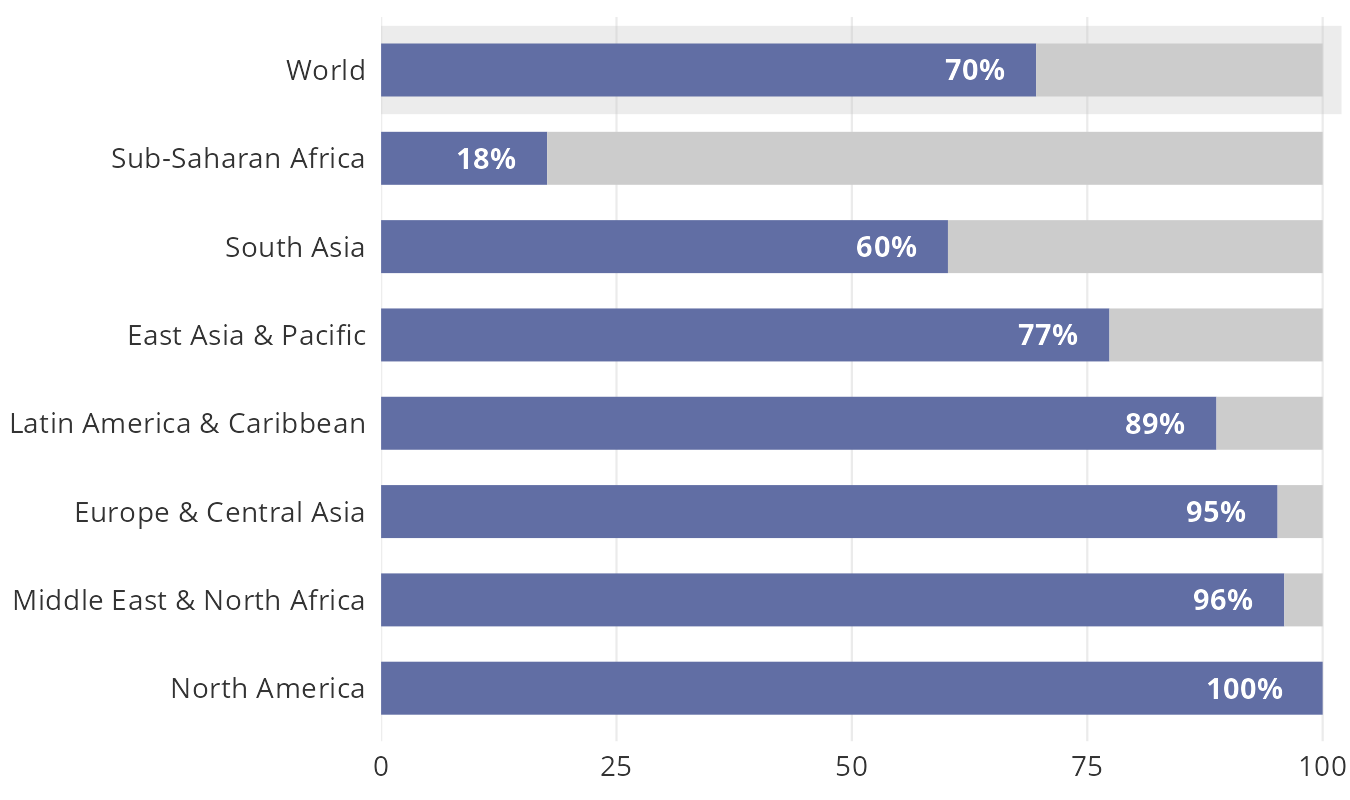
7.1
In 2020, 70 percent of the world population had access to clean fuels and technologies for cooking. However, access ranges from 18 percent in Sub-Saharan Africa to 100 percent in North America.
Access to clean fuels and technologies for cooking (% of population), 2020
Source: World Bank Global Electrification Database from [link: https://trackingsdg7.esmap.org/ Tracking SDG 7: The Energy Progress Report] led jointly by the custodian agencies: the International Energy Agency (IEA), the International Renewable Energy Agency (IRENA), the United Nations Statistics Division (UNSD), the World Bank and the World Health Organization (WHO). Retrieved from World Development Indicators ([link: https://data.worldbank.org/indicator/EG.CFT.ACCS.ZS EG.CFT.ACCS.ZS]).DOWNLOAD
SDG target
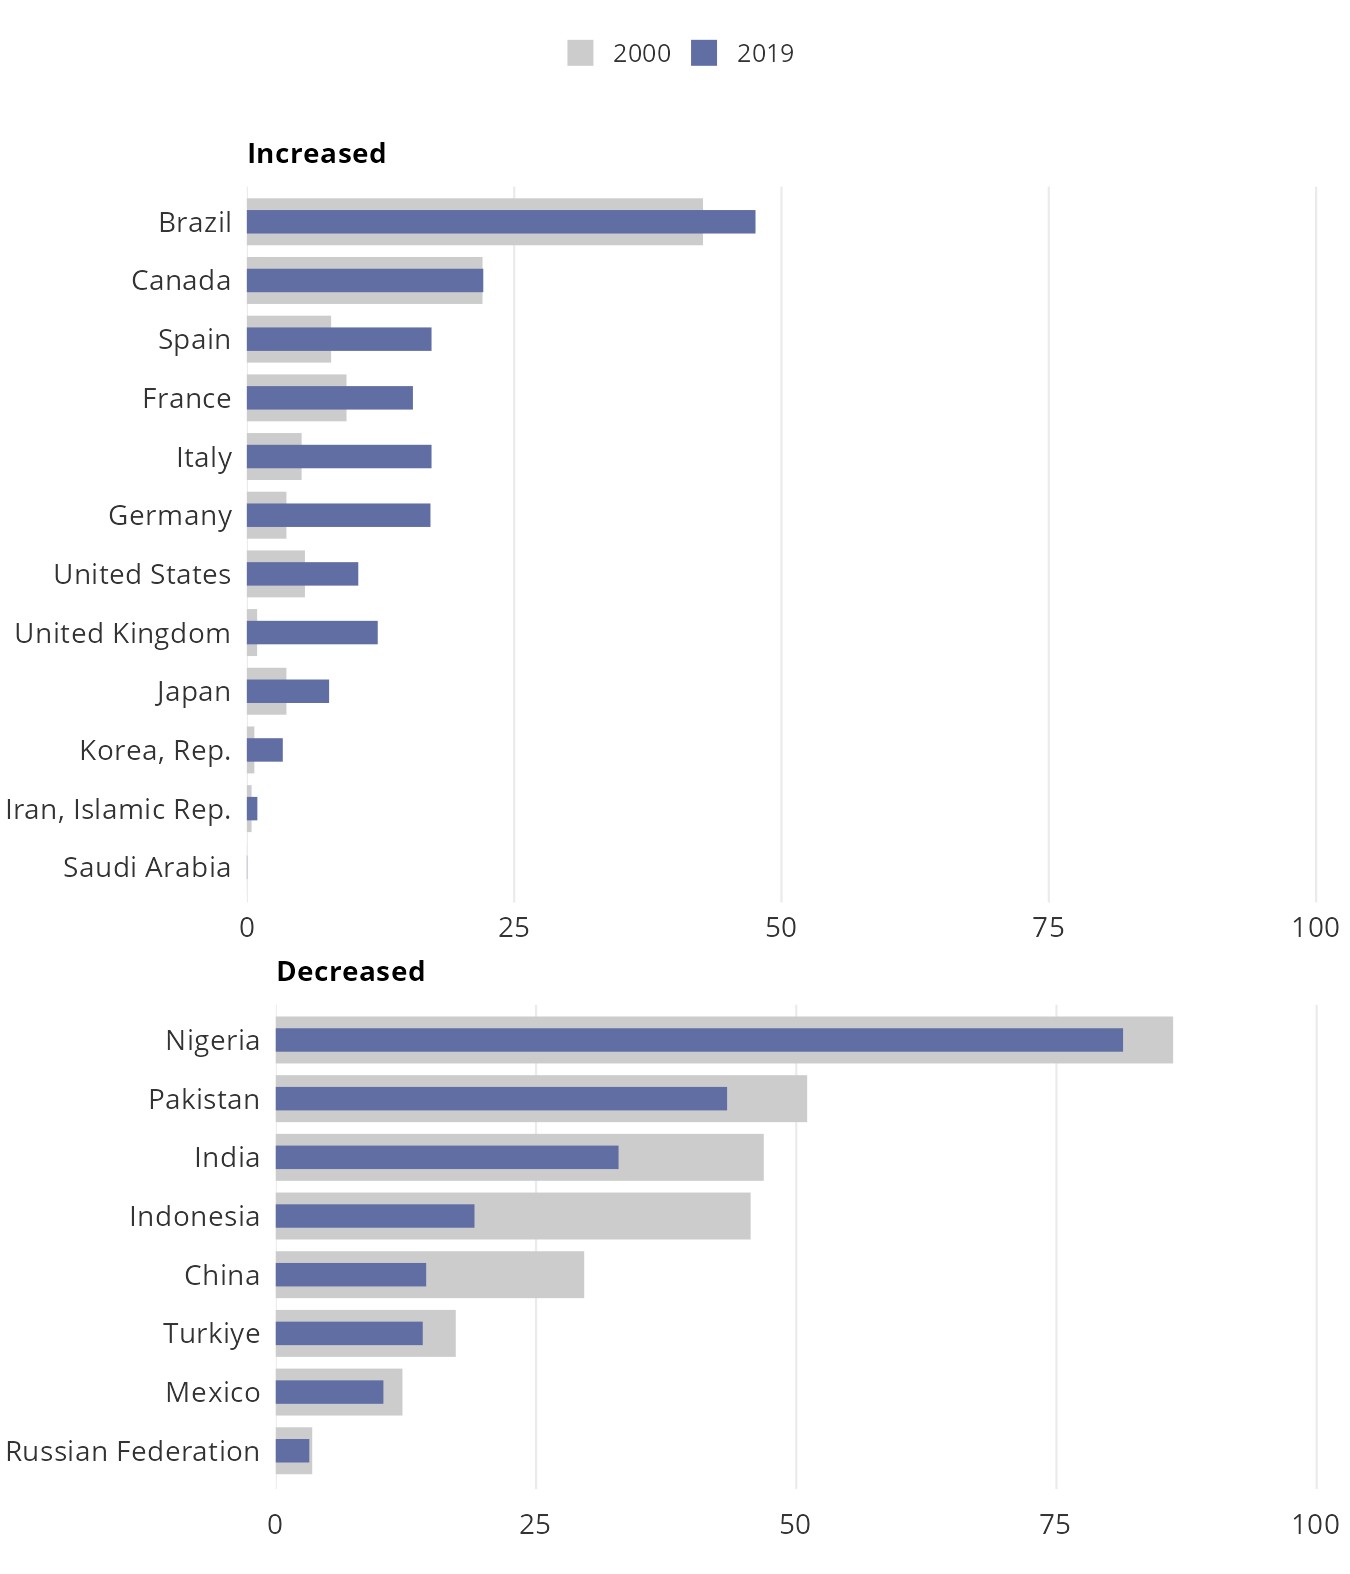
7.2
Renewable energy as a share of total energy consumption increased in 12 of the top 20 energy-consuming countries between 2000 and 2019.
Renewable energy share in the total final energy consumption (%) of the top 20 energy-consuming countries, 2000 and 2019
* Ten out of twelve countries where this share has increased are high-income countries. The other two, Iran and Brazil, are upper-middle income. All of the countries where this share has decreased are either upper- or lower-middle income countries.
Source: World Bank Global Electrification Database from [link: https://trackingsdg7.esmap.org/ Tracking SDG 7: The Energy Progress Report] led jointly by the custodian agencies: the International Energy Agency (IEA), the International Renewable Energy Agency (IRENA), the United Nations Statistics Division (UNSD), the World Bank and the World Health Organization (WHO). Retrieved from World Development Indicators ([link: https://data.worldbank.org/indicator/EG.FEC.RNEW.ZS EG.FEC.RNEW.ZS]).DOWNLOAD
SDG target
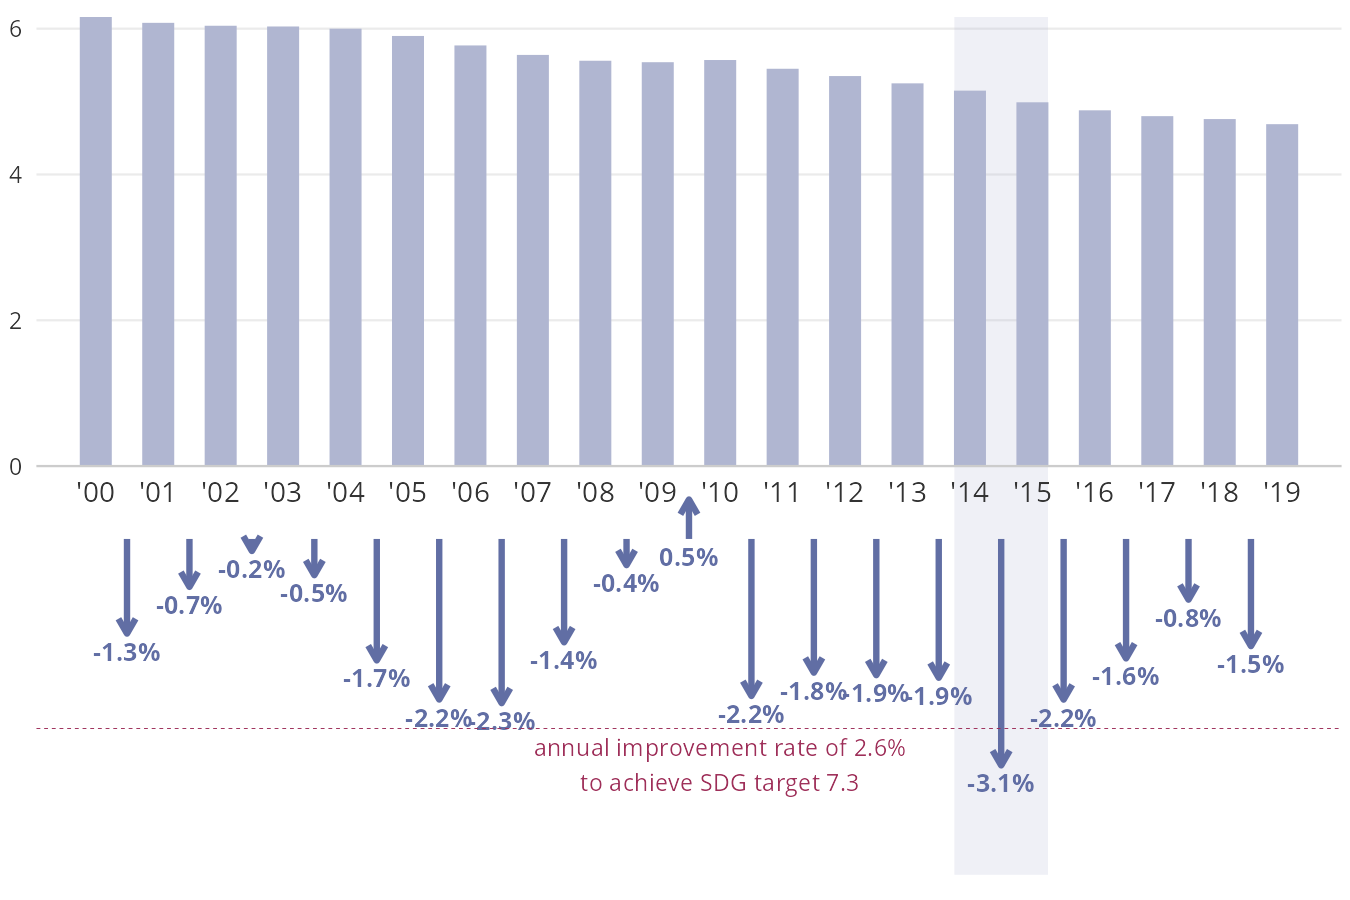
7.3
The rate of improvement in primary energy intensity has slowed since 2014. From 2018 to 2019, primary energy intensity fell by 1.5 percent to reach 4.7 megajoules per dollar.
Energy intensity level of primary energy (megajoules per constant 2017 PPP GDP) and its year-on-year percentage change (arrow), 2000–2019
* The year-on-year percentage change is below the target annual rate of improvement of 2.6 percent, which has only been reached from 2014 to 2015. Primary energy intensity is defined as the ratio of total energy supply to annual GDP. The rate of improvement is measured as the year-on-year percentage change. An annual improvement rate of 2.6 percent between 2010 and 2030 was recommended by the UN, but due to slow progress, the required rate may now be as high as 3.2 percent.
Source: World Bank Global Electrification Database from [link: https://trackingsdg7.esmap.org/ Tracking SDG 7: The Energy Progress Report] led jointly by the custodian agencies: the International Energy Agency (IEA), the International Renewable Energy Agency (IRENA), the United Nations Statistics Division (UNSD), the World Bank and the World Health Organization (WHO). Retrieved from World Development Indicators ([link: https://data.worldbank.org/indicator/EG.EGY.PRIM.PP.KD EG.EGY.PRIM.PP.KD]).DOWNLOAD