Measuring learning outcomes
The Programme for International Student Assessment (PISA) assesses 15-year-old students’ literacy in reading, mathematics, and science (target 4.1). In 2015 success in reading was widespread, but mathematics was more challenging (figure 4a). In 9 of the 49 countries surveyed fewer than two-thirds of students attained the lowest mathematics proficiency level.Literacy and numeracy are critical at all ages for individual and national development (target 4.6), but can be difficult to measure. For instance, school-based assessments do not cover children who are not attending school. The number of people who are literate or illiterate is often based on self-reported data, and some countries apply different lengths of school attendance or levels of completion to declare a person literate. The most recently available data show that around 85 percent of the world’s adults have basic literacy (figure 4b). But the level and speed of achievement vary across regions and by age group.
Leaving no child behind
Ninety percent of children worldwide completed a full course of primary education in 2014, but just 75 percent went on to finish lower-secondary education (figure 4l). Access to education—ensuring learning opportunities for all children, youths, and adults, regardless of background or circumstance—has been one of the main goals of the global development agenda for more than 25 years and continues to be a priority (target 4.5).
The number of children not attending primary school was halved worldwide over the past two decades, driven by large increases in school enrollment in China and India (figure 4k). In addition, Sub-Saharan Africa reduced the number of out-of-school children by 27 percent from 47 million in 1996 (the peak) to 34 million in 2014, despite 59 percent growth in the primary school–age population over that period.
Still, around 61 million primary school–age children remained out of school in 2014—a third of them in India, Nigeria, Pakistan, and Sudan, many from poor households. In Nigeria 71 percent of children from poor households were not attending school in 2013, compared with only 5 percent of children from rich households (figure 4m). The gaps in Pakistan and India are similar.
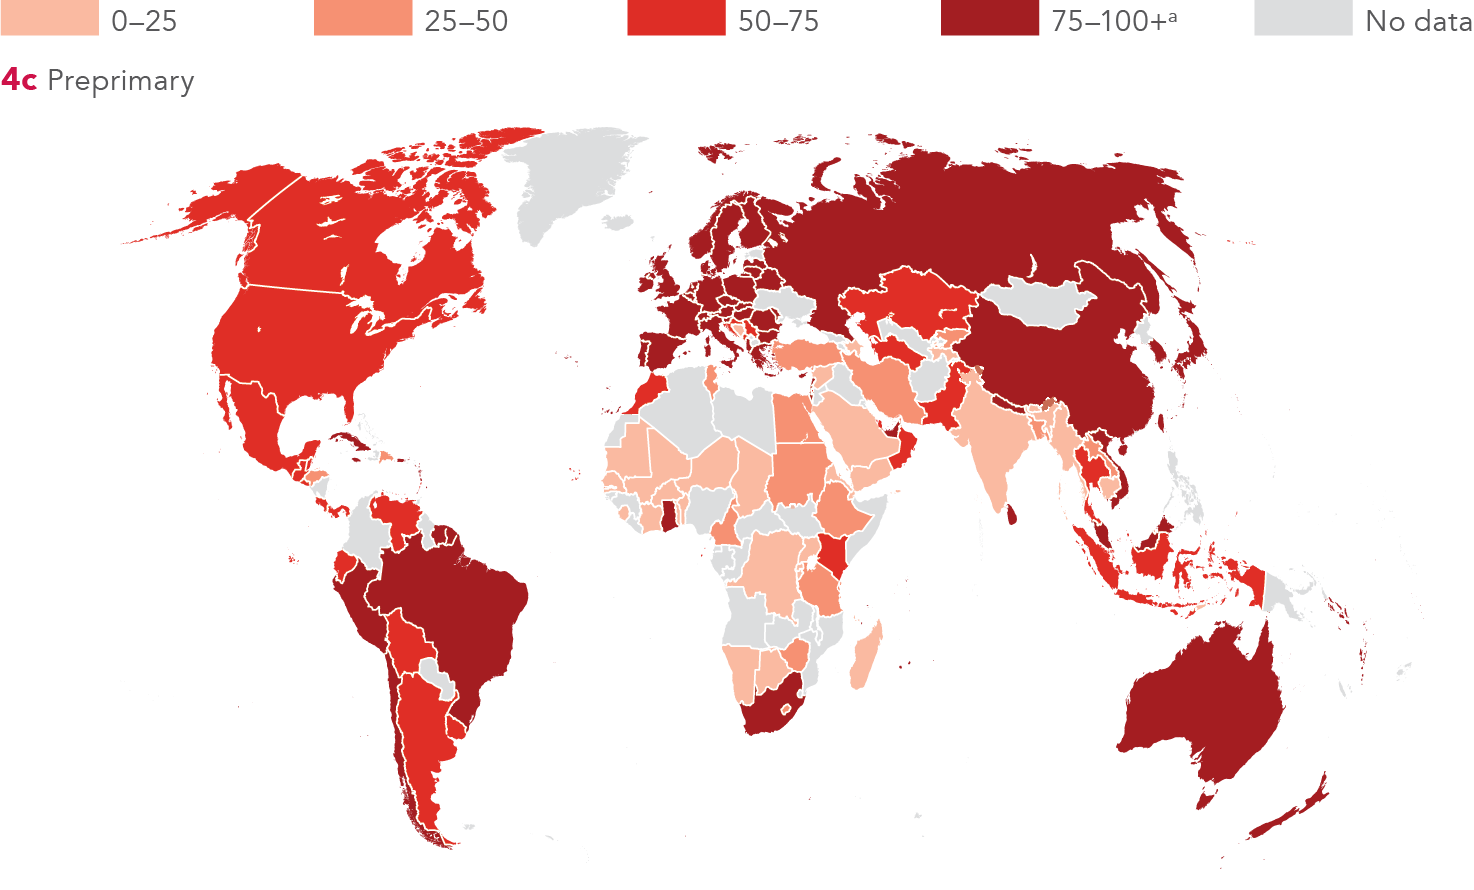
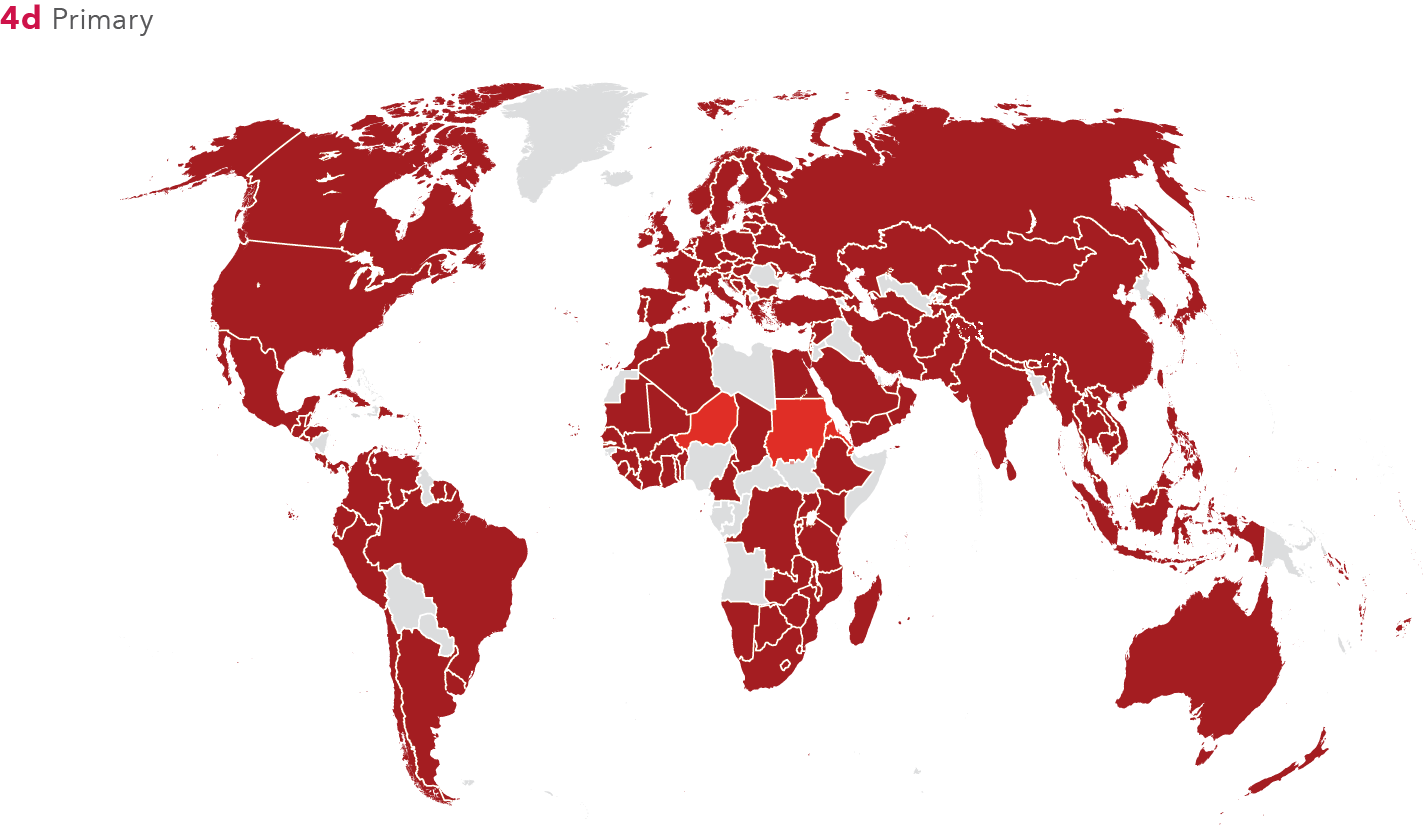
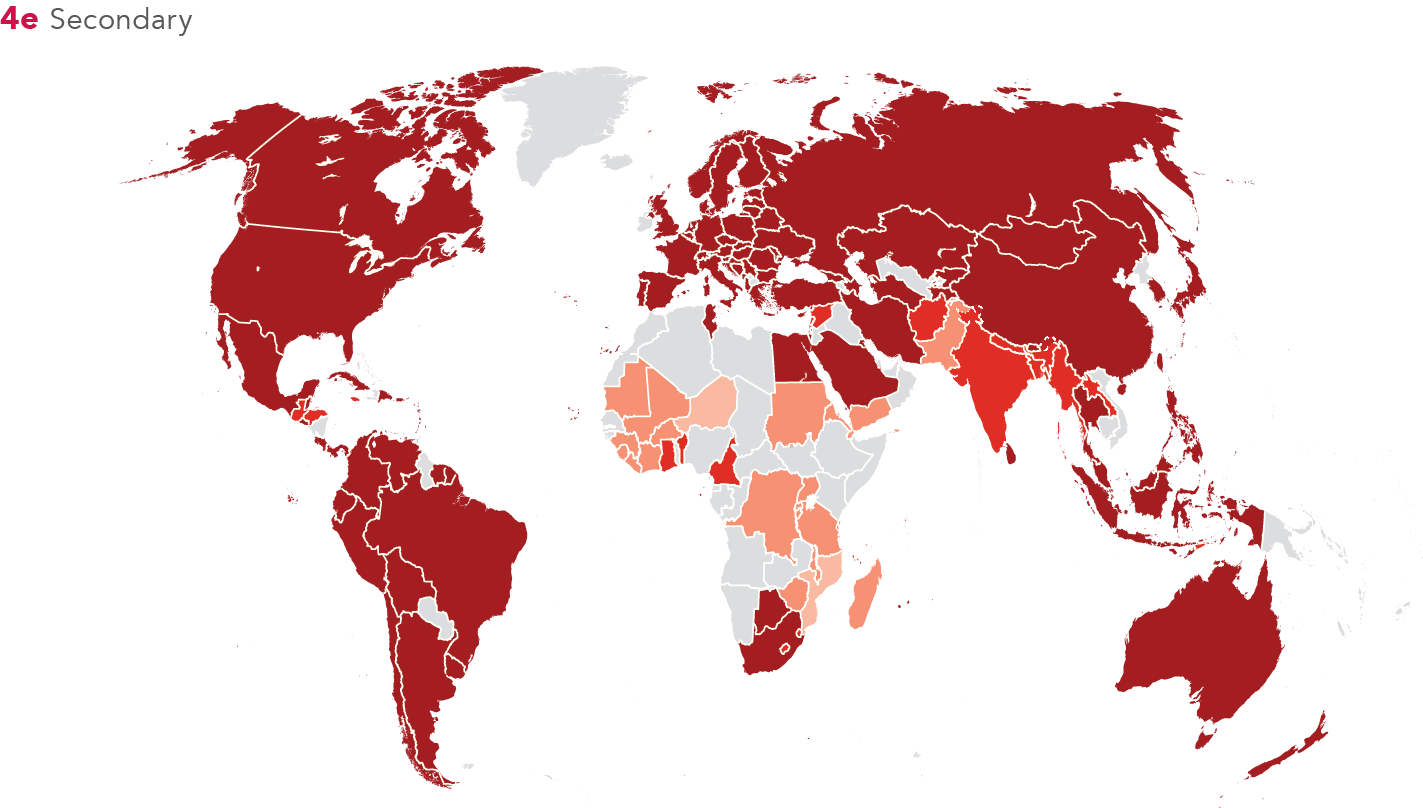
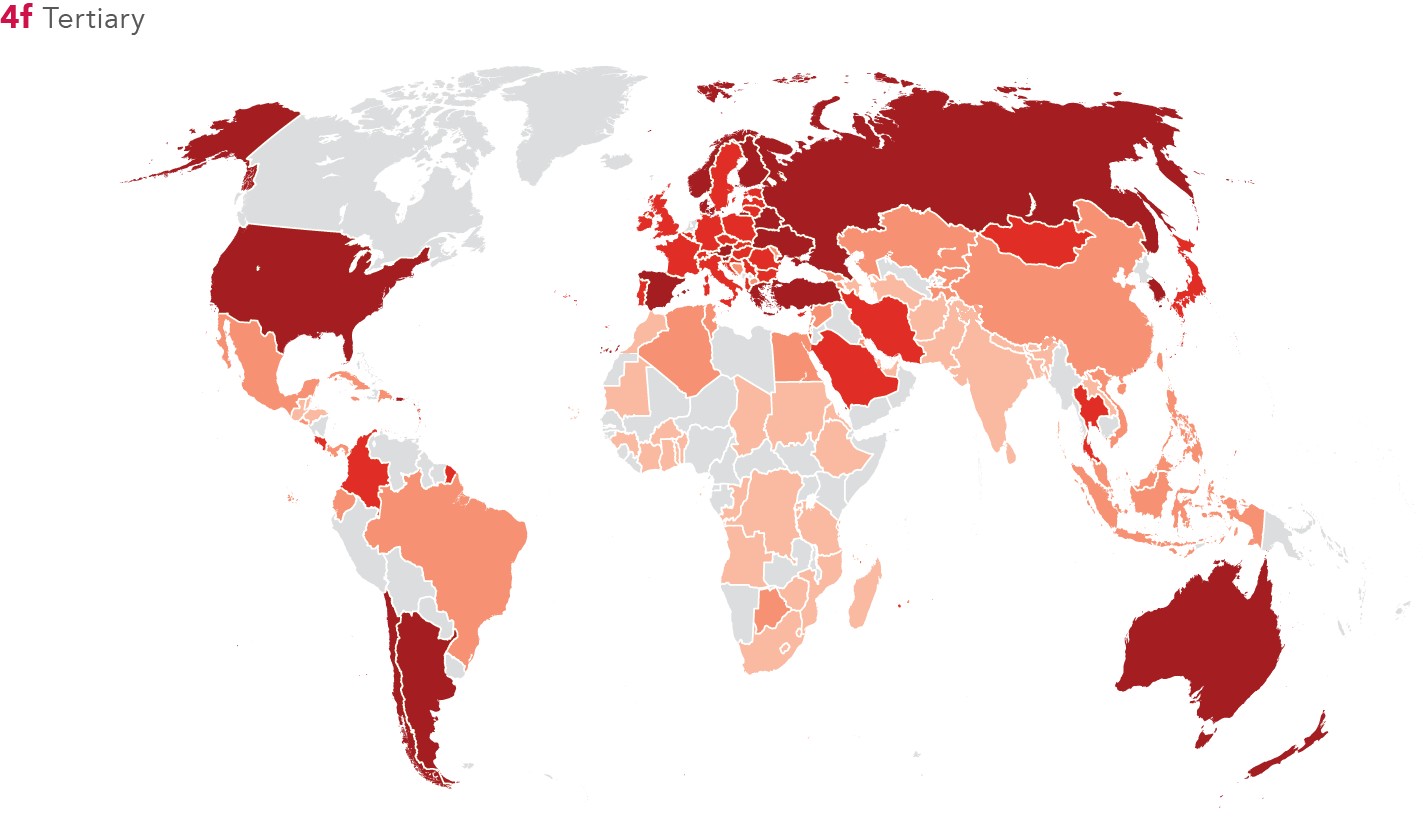
Children in low- and middle-income countries are less likely to enroll in school as they get older (figures 4g–4j). The trend is seen across both rich and poor households, but the gap is substantial. There is also inequity in education between children from rural and urban areas in many countries: those from urban areas are almost three times more likely than children from rural areas to complete nine years of schooling in Senegal (figure 4n). And girls are disadvantaged in either case. Girls from poor households are less likely than boys from poor households to complete nine years of schooling; and the trend is similar for girls from rural households.
Filling the data gaps
Measuring learning achievements across the globe remains a challenge for Goal 4. While many types of learning assessments are available, different methods and varied coverages of ages, subjects, and years make comparisons across countries difficult. Also difficult is defining a "minimum competency" in different social contexts. Data availability is also a challenge. For example, the United Nations Children's Fund generates the Early Child Development Index to measure the developmental status of children, but data are available only for a few countries (target 4.2). While data disaggregated by sex and wealth quintile are available (target 4.5), parity indices for disability, ethnicity, and language are more limited.
Notes
- UNESCO Institute for Statistics (UIS). 2016. Sustainable Development Data Digest: Laying the Foundation to Measure Sustainable Development Goal 4. Montreal, Canada: UIS. http://www .uis.unesco.org/Education/Documents/uis-sdg4 -digest-2016.PDF.