Easing daily life through access to energy
Modern energy improves many areas of daily life. Better sanitation systems, well functioning health care and education services, and dependable transportation and telecommunications all depend on reliable electricity. Lighting a single room allows a child to read or do homework at night, while continuous power can support larger appliances, keep food cold, and allow businesses to flourish. Other alternatives, where they exist, often have significant health or pollution risks. Emissions from inefficient household energy sources like kerosene and traditional biomass can directly contribute to diseases and premature mortality among the poorest people, who have little or no access to health care. Goal 7 seeks to expand access to affordable, reliable, and modern energy services to all (target 7.1).
Expanding access to electricity
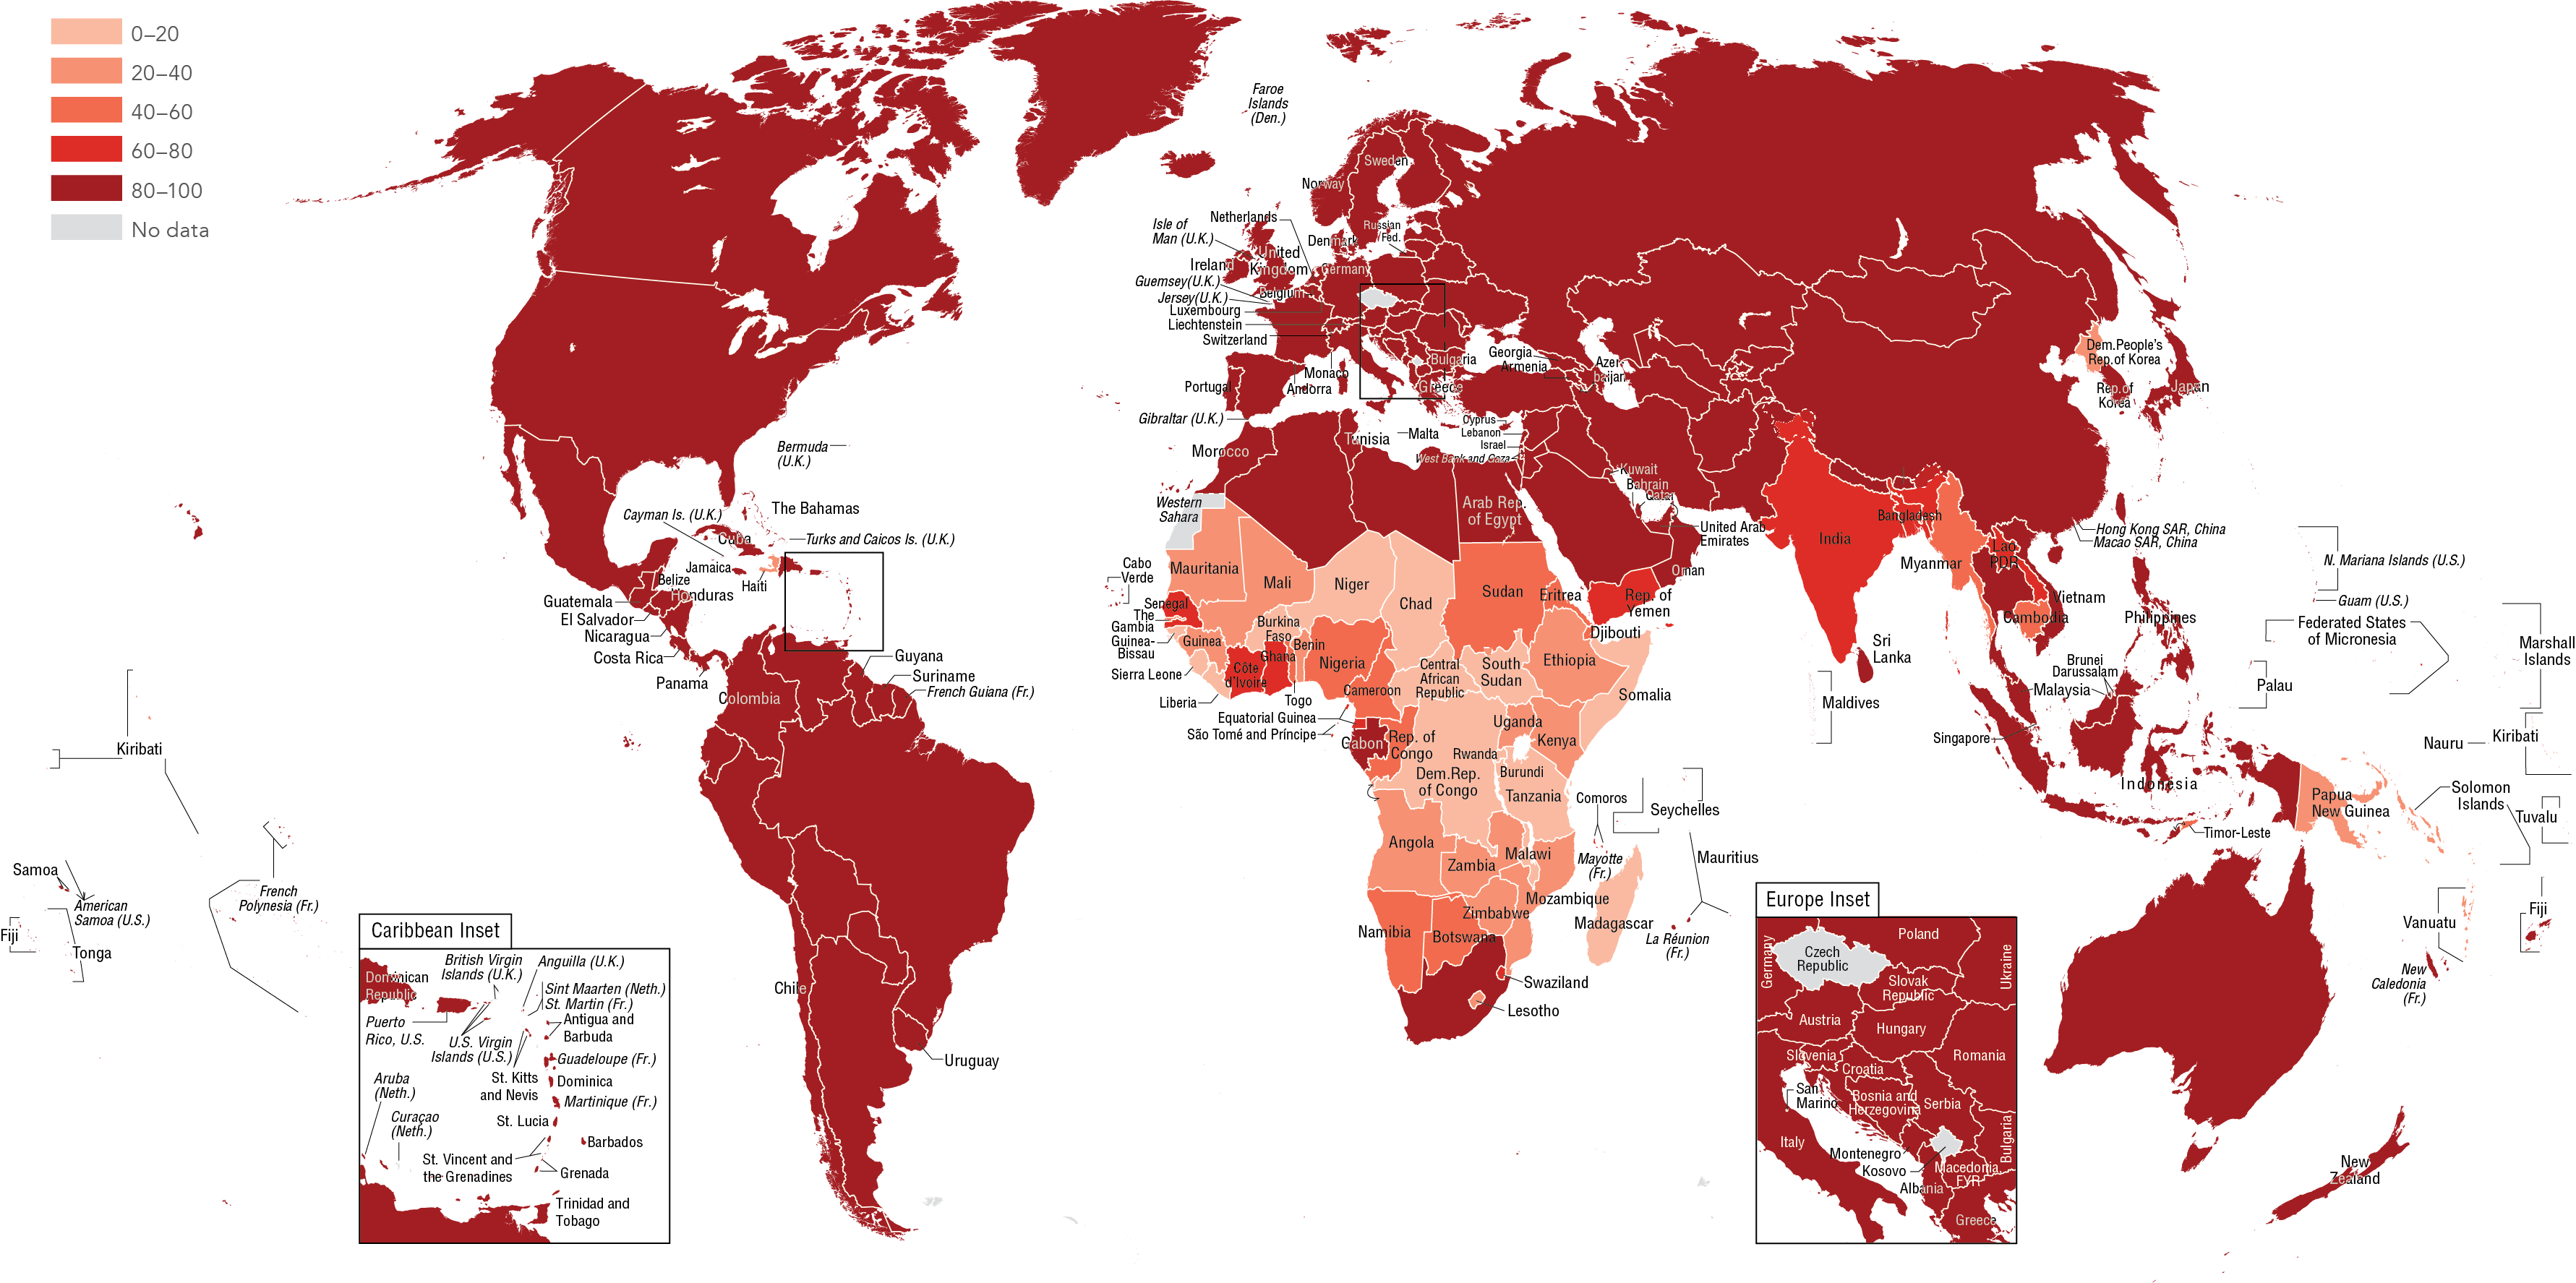
In 2014 around 15 percent of the world's population had no access to electricity (figures 7d and 7e). Nearly half were in rural areas of Sub-Saharan Africa, and nearly a third were rural dwellers in South Asia. In all, 86 percent of people without electricity lived in rural areas, where providing infrastructure is more challenging. Of the remainder in urban areas, most were in Sub-Saharan Africa (figure 7a).
Electrification has expanded in all regions and in both urban and rural areas. South Asia has driven global declines in the share of the rural population without access to electricity, with just 28 percent of rural dwellers lacking electricity in 2014, compared with 68 percent in 1991, while the urban rate fell from 18 percent to 3 percent.
In most regions, electrification has outpaced population growth. An exception is Sub-Saharan Africa, where electrification has not kept up with population growth: 154 million more people in rural areas lacked access in 2014 than in 1991. Similarly, the number of people in urban areas without access rose from 58 million in 1991 to about 108 million in 2014.
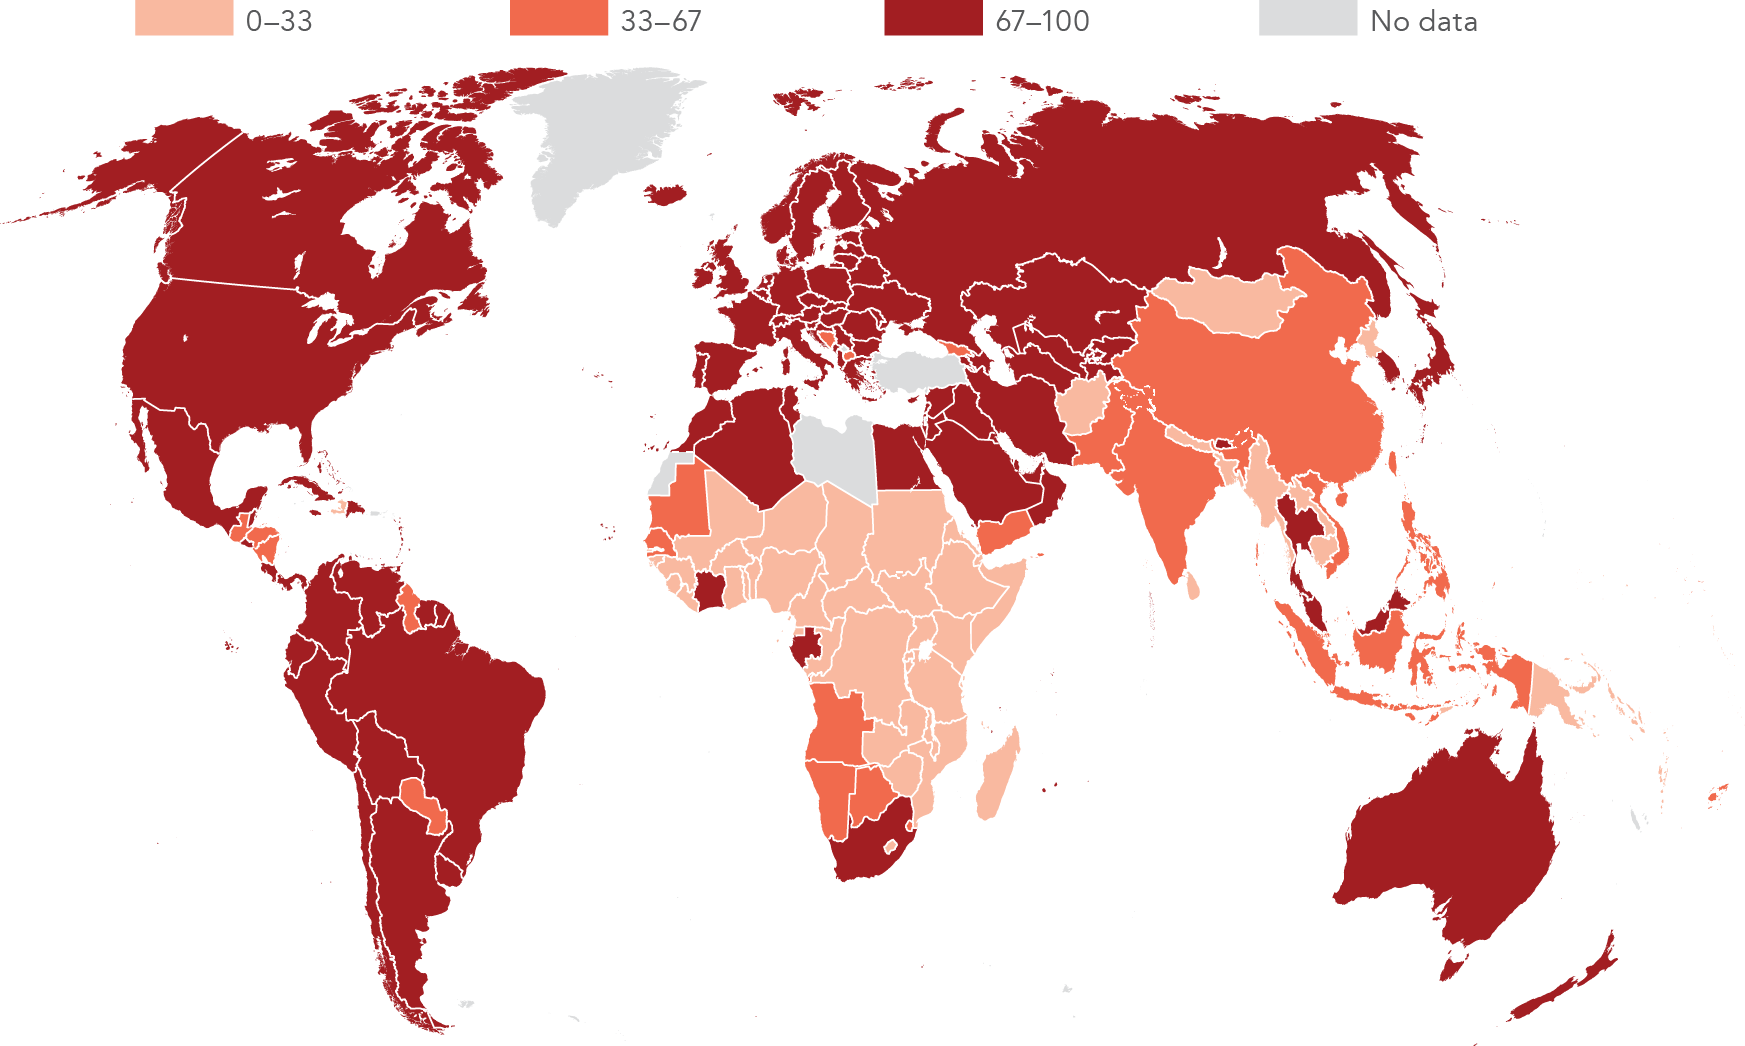
Converting to clean cooking fuels
Clean cooking fuels and technologies are in many cases less hazardous to health and the environment than their alternatives. In 2014 more than 40 percent of the global population—mostly in South Asia, East Asia and Pacific, and Sub-Saharan Africa—had no access to these fuels (figure 7b).
Access to clean cooking fuels and technologies has not expanded as fast as access to electricity. In South Asia 77 percent of people did not have access to these fuels in 2000. While that share dropped to 68 percent by 2014 (figure 7c), it was insufficient to keep up with population growth, leaving an additional 91 million people without access.
Access has improved in East Asia and Pacific—both in terms of population share and number of people affected. Over half of all people did not have access to clean cooking fuels and technologies in 2000; in 2014 this share dropped to 42 percent. Despite a rise in the total population of 11 percent, 206 million fewer people lacked access than 14 years earlier.
A large population rise and a negligible fall in the percentage of people lacking access to clean cooking fuels and technologies in Sub-Saharan Africa (from 87 percent in 2000 to 86 percent in 2014) means that, in 2014, 250 million more people lacked access than in 2000.
Measuring modern energy access in new ways
Energy access is currently measured through a simple binary indicator: either a house, village, or facility is connected to a power grid or it is not. But a connection does not mean that electricity is always available and affordable. Conversely, advances in low-cost and effective off-grid systems now mean that a grid connection may not be necessary to enjoy some important benefits of modern energy. These innovations are particularly relevant for the many people without access to electricity in rural areas, where traditional grid expansion is most costly.
The measurement framework for energy access is under revision. It will eventually take into account many aspects of energy delivery, such as the source and its capacity, the duration of access and its reliability, the quality of energy delivered (such as voltage), the affordability of access, and the legality of the energy provision. Access to electricity will be defined in five tiers: tier 1 encompasses basic lighting and phone charging; tier 2 includes a television and electric fan; tier 3 includes the use of low-intensity and discontinuous thermal or mechanical applications, such as washing machines or food processors; and tiers 4 and 5 enable heavier and continuous applications, such as air-conditioning and space heating.1 It is likely that many people now counted as having access to electricity will fall in the lower tiers; but others with off-grid power may reach tiers 1 or 2, despite currently being counted as not having access.
Shifting to renewable energy
Goal 7 promotes more use of renewable energy to counter dependence on unsustainable, nonrenewable sources (target 7.2). The share of renewables in the global energy mix stood at just under 19 percent in 2014.
However, this is uneven across regions: the renewable share in the Middle East and North Africa stands at 1.8 percent, while the share in North America is under 10.5 percent. Sub-Saharan Africa has the highest share of renewables in its energy use—over 70 percent—while South Asia records 40 percent. These high shares reflect the practice in many low- and lower-middle-income countries of reliance on traditional biomass for fuel.
For the first time, renewables accounted for more than half of net annual additions to power capacity globally and overtook coal in terms of cumulative installed capacity in the world.2 Of the renewables, hydropower accounts for over 60 percent of total capacity, but wind and solar photovoltaic are now dominating the new capacity added each year (figure 7f).
Driving energy efficiency
Goal 7 aims to double the global rate of improvement in energy efficiency (target 7.3). Energy efficiency refers to the amount of output that can be produced by using a given amount of energy—for example, kilometers traveled per liter of fuel. A related economywide measure, energy intensity, reflects the amount of energy required to produce a certain value of output. As energy efficiency increases, energy intensity declines, though the decline also reflects other factors, such as changing patterns of production and consumption. Global energy intensity was around 5.8 megajoules per purchasing power parity dollar of output in 2010—that is, each dollar of output required an energy input equivalent to 0.18 liters of gasoline. This decline was from 7.6 megajoules per dollar in 1990, an average decline over the two decades of around 1.34 percent a year.
By 2014 global energy intensity had fallen further, to 5.4 megajoules per dollar, accelerating the annual decline to 1.9 percent—but still short of the target of 2.6 percent (which would amount to a doubling of the world decline over 1990–2010). However, 7 of the 20 largest energy consumers did achieve the target, showing that decoupling growth from energy use is possible in both high-income countries and emerging economies (figure 7g).
Notes
- ESMAP (Energy Sector Management Assistance Program). 2015. Beyond Connections: Energy Access Redefined. ESMAP Technical Report 008/15. Washington, DC: World Bank Group. https://openknowledge.worldbank.org/handle/10986/24368.
-
World Bank, Global Tracking Framework 2017.