Rising aid flows
Members of the Development Assistance Committee (DAC) of the Organisation for Economic Co-operation and Development extended $131.6 billion in official development assistance (ODA) in 2015 (figure 17b opposite). After adjustment for inflation and exchange rate valuations, this represents an increase of 6.9 percent in real terms from 2014 and of 83 percent from 2000. But ODA still accounts for a small share of donors' gross national income (GNI), averaging 0.3 percent. Just six DAC countries exceeded the UN benchmark for ODA contributions of at least 0.7 percent of GNI (target 17.2). The three largest donors by volume—the United States, the United Kingdom, and Germany—accounted for more than half of DAC ODA. Bilateral aid to the poorest countries rose 4 percent in real terms in 2015, reflecting the commitment by DAC donors to refocus aid where it is needed most. But much of the increase in flows was attributable to a rise in humanitarian aid rather than to development projects and programs.
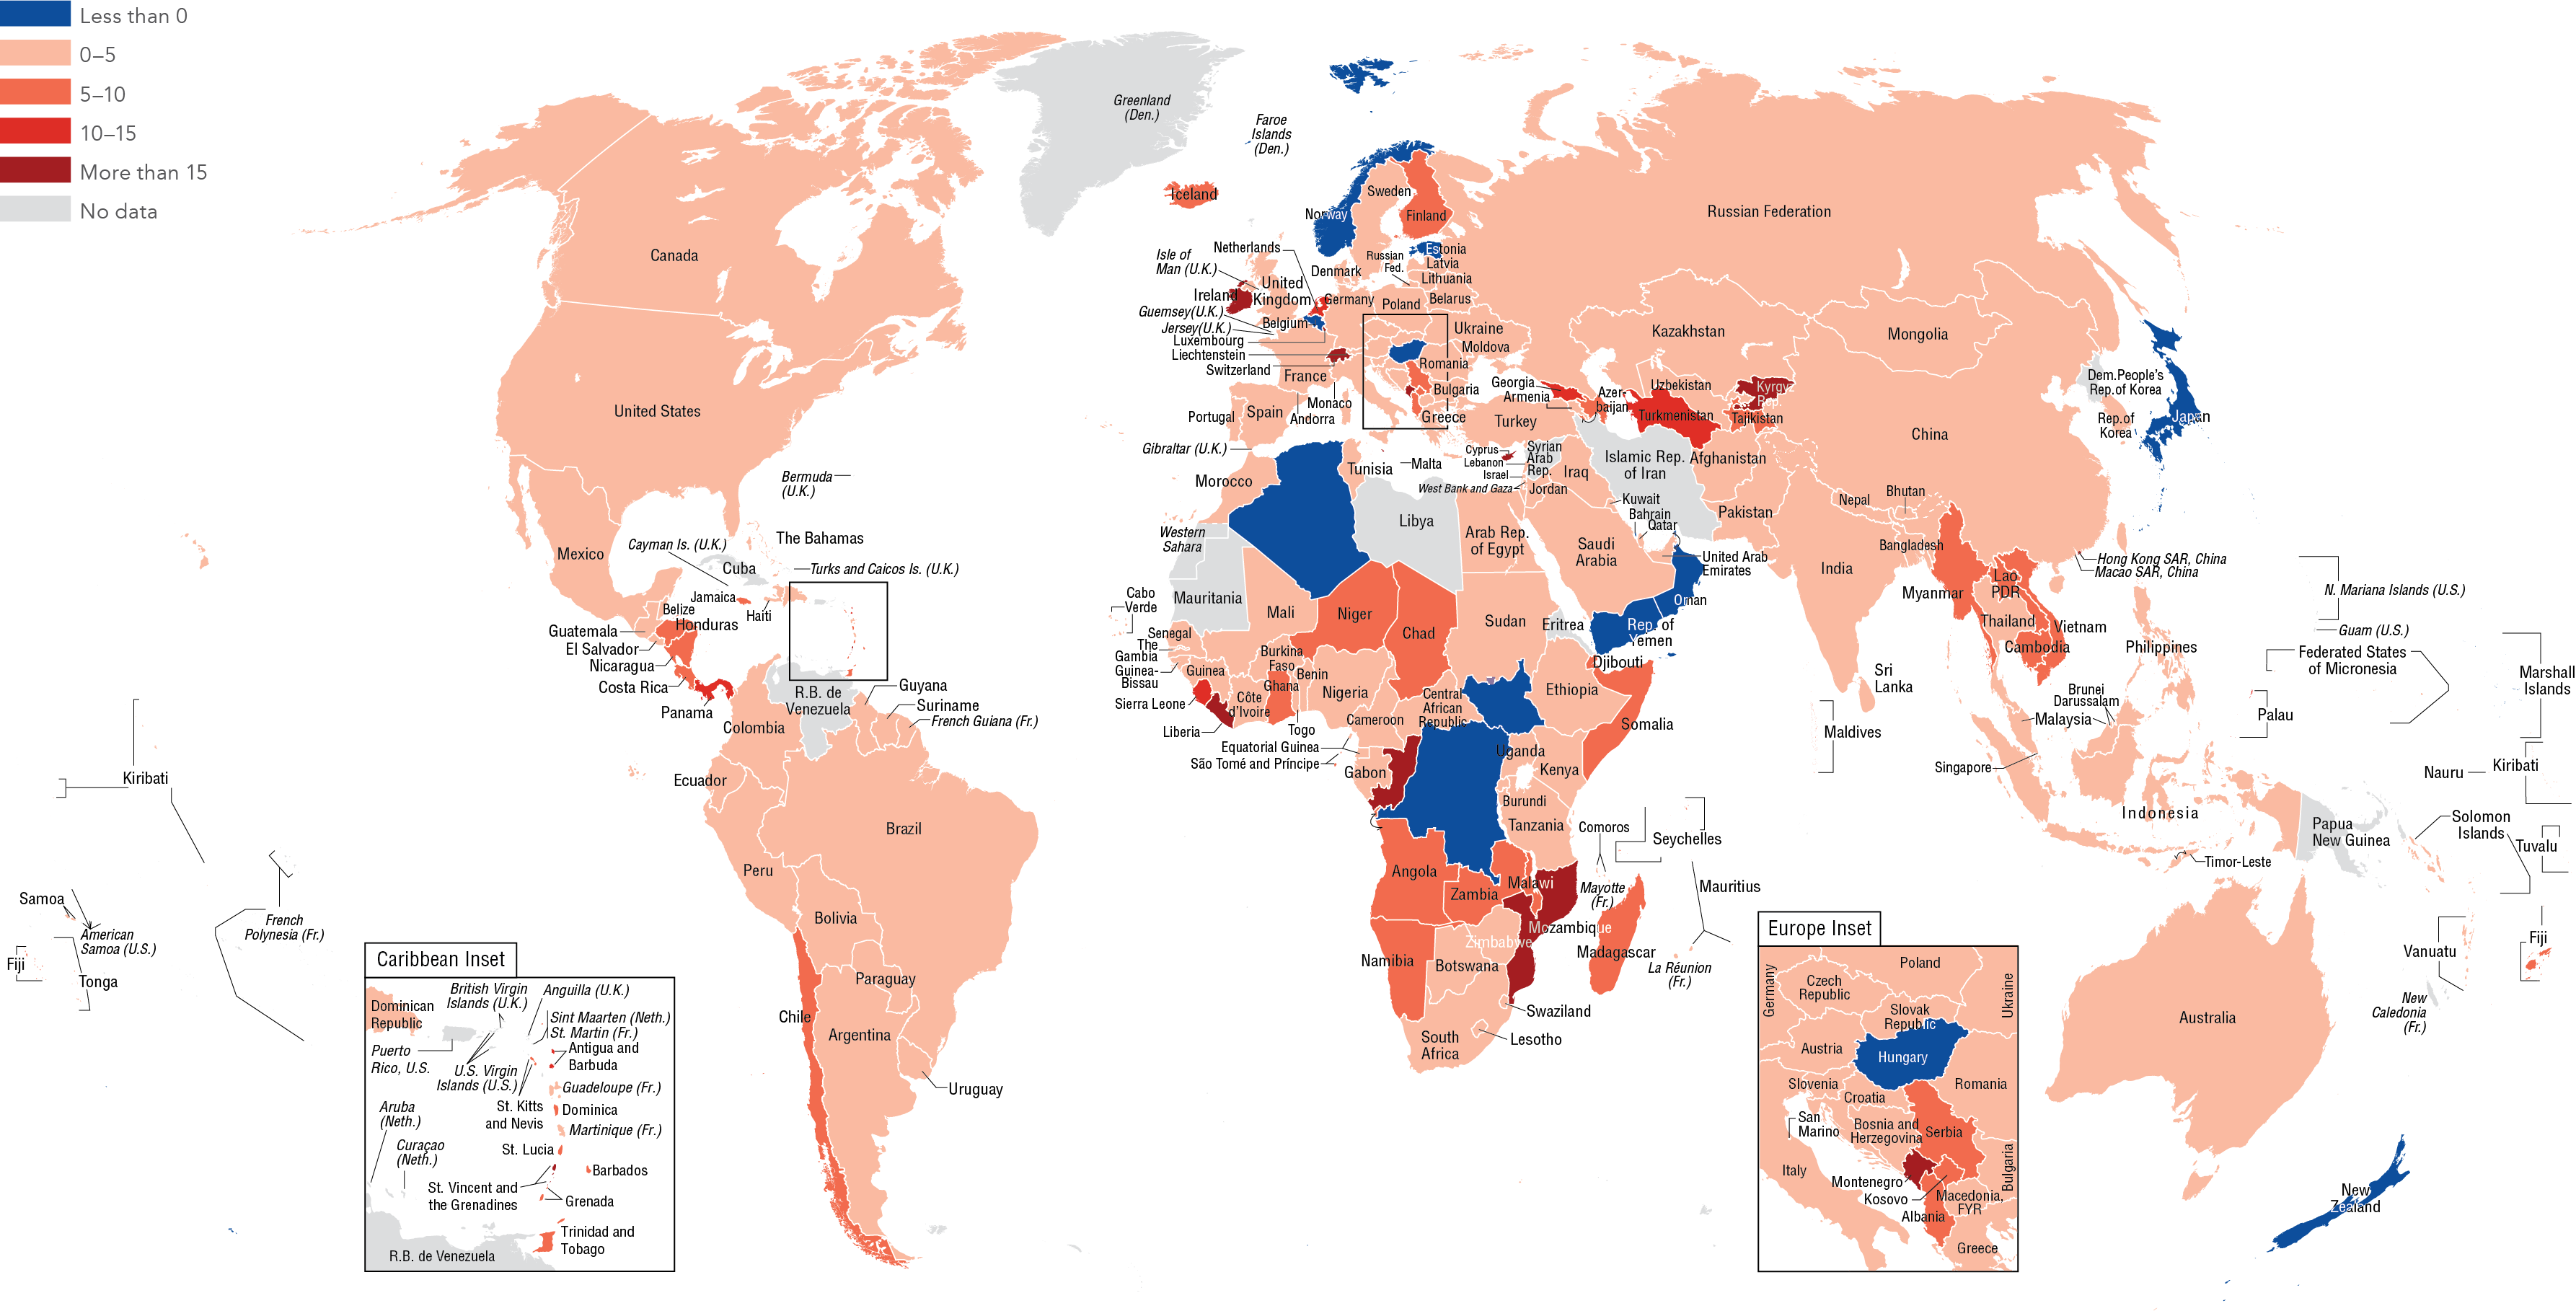
Addressing the cost of the refugee crisis
The share of countries' net ODA spent on hosting or processing refugees increased from 5 percent in 2014 to 9 percent in 2015, largely as a result of more refugees arriving in Europe. In Germany, one of the most affected countries, in-donor country spending on refugees rose to nearly 17 percent of net ODA in 2015, up from 1 percent the previous year. In Sweden the comparable expenditures absorbed nearly 34 percent of net ODA, double that of the year before, and in Austria they accounted for 27 percent in 2015, triple that of 2014. In seven EU countries, in-country spending on refugees was greater than 15 percent of net ODA in 2015 (figure 17a).
Increasing foreign direct investment
FDI flows to low- and middle-income countries have increased substantially over the past decade (figures 17c–17e). Such flows are attractive because they are in large part equity investment and thus non–debt creating. They bring such benefits as skills and technology transfer to domestic firms and their labor force as well as productivity gains and greater access to domestic and export markets. Global flows of FDI rose an estimated 22 percent in 2015, to $2.2 trillion, driven by a surge in mergers and acquisitions in high-income countries (figure 17g). FDI proved resilient with the majority of countries posting higher inflows in relation to GDP.
Financing infrastructure through public–private partnerships
Public–private partnerships (PPPs) can make an important contribution to the delivery of efficient public services (target 17.17). Between 1991 and 2015, investments in PPP infrastructure commitments totaled $1.5 trillion in 118 low- and middle-income countries and covered more than 5,000 projects, such as the construction of roads, bridges, light and heavy rail, airports, power plants, and energy and water distribution networks.1 The average investment in the 65 low- and middle-income countries with investments between 2011 and 2015 was 0.8 percent of GDP. In low-income countries, projects were split equally between the energy and transport sectors, the latter bolstered by a large port terminal in Togo, while in richer countries the energy sector was predominant. Water projects accounted for a negligible investment globally (figures 17h and 17i).
Nearly two-thirds of PPP energy investment in 2015 focused on renewable sources, with solar and wind energy sources accounting for over half (figure 17j).
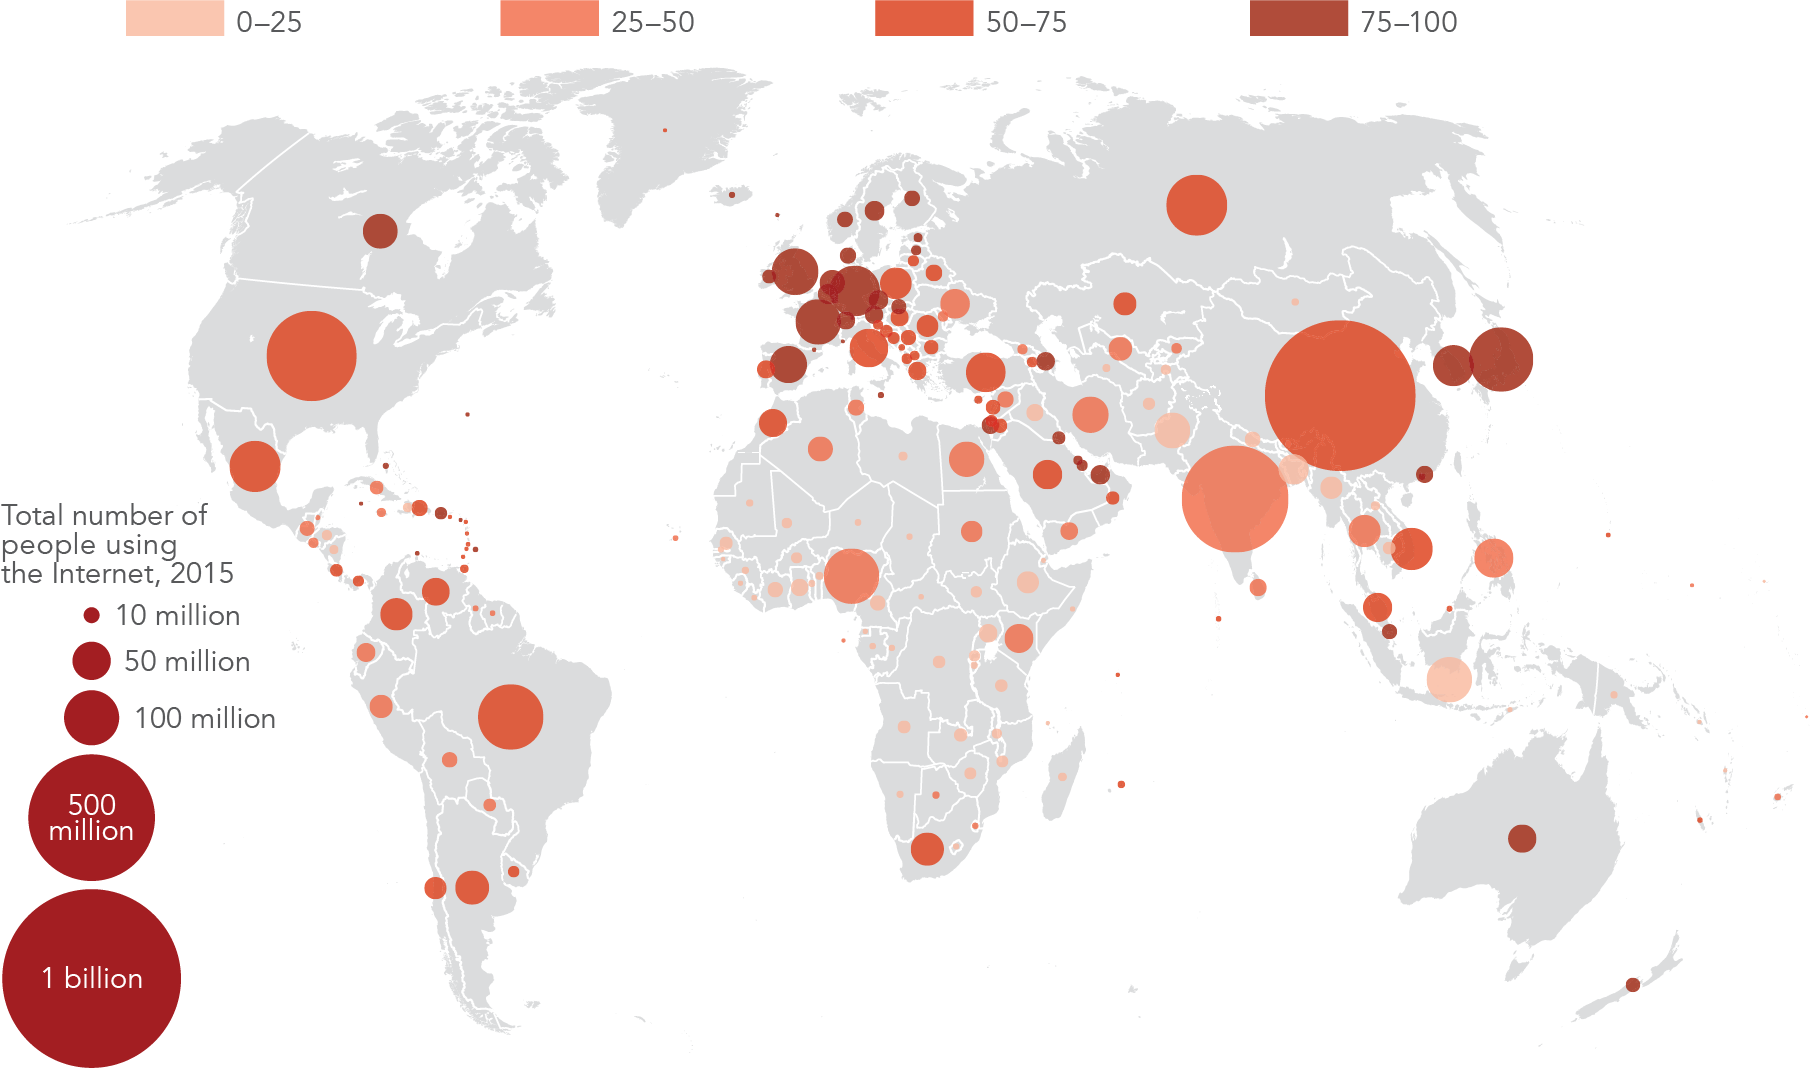
Expanding access to the Internet
In 2015 China had the most Internet users of any country: approximately 705 million. Nearly 44 percent of the global population used the Internet (figure 17k), and North America and Europe and Central Asia had the highest rate of users, of fixed broadband subscriptions and of secure Internet servers (target 17.6). Goal 17 recognizes that enabling the use of information and communications technology in the poorer countries of South Asia and Sub-Saharan Africa will bolster capacity building in science, innovation, and technology. Target 17.8 aims to increase access for people in the 48 Least Developed Countries, where on average, fewer than 13 percent of people have access to the Internet.
Facilitating trade
Trade is paramount to sustaining development and advancing economic growth, and inclusive trade facilitation is a powerful tool to foster global competitiveness (targets 17.10, 17.11, and 17.12).
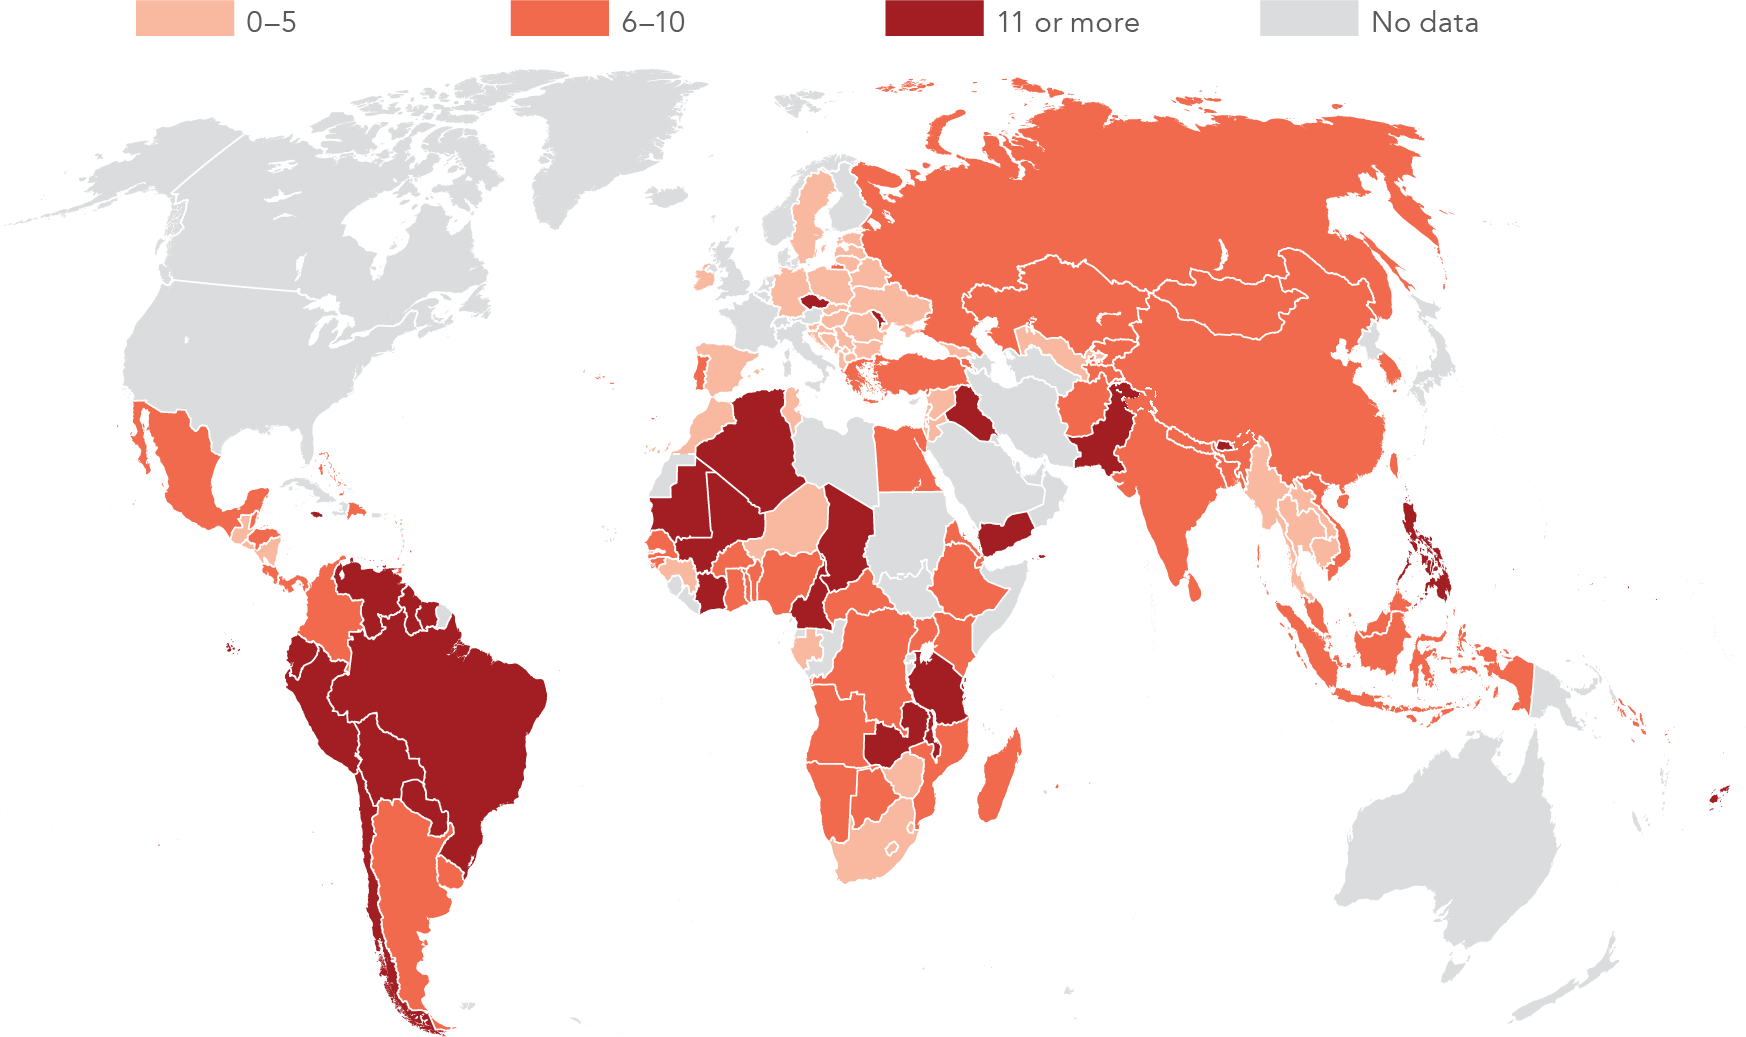
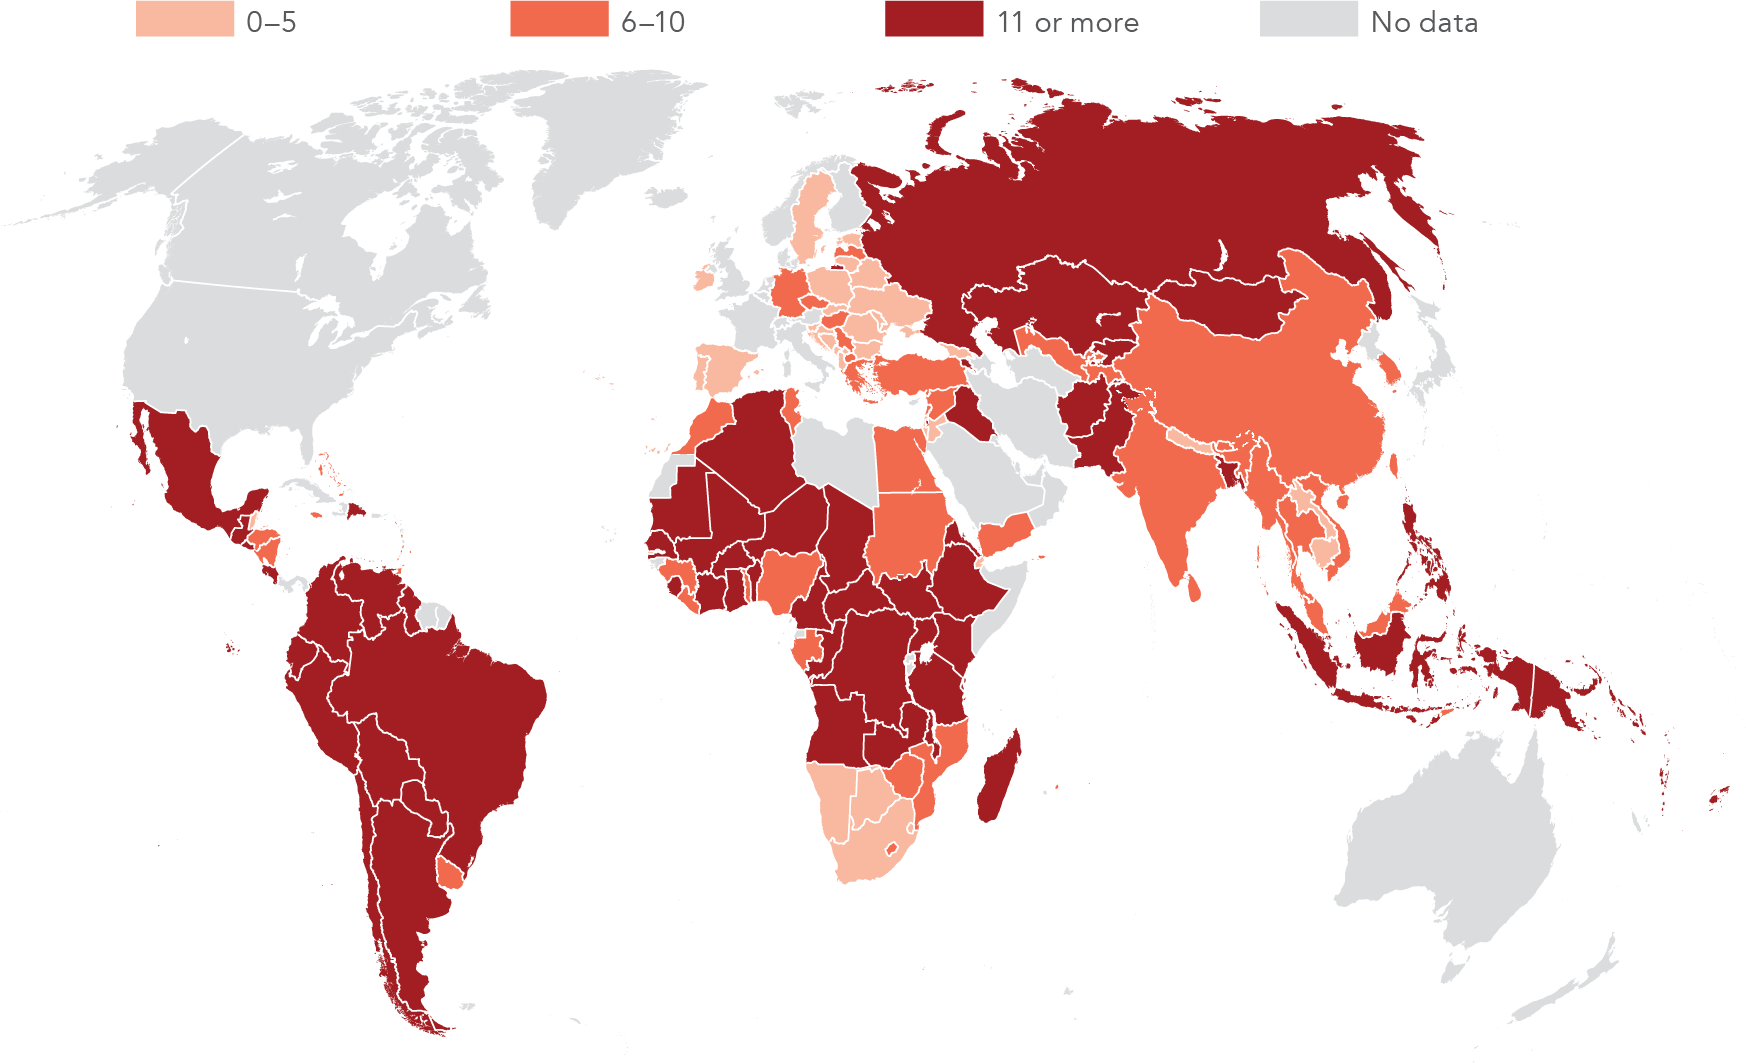
Effective and efficient customs processes are fundamental to good trade practices: delays in clearing customs for exports and imports increase costs to firms, interrupt production, interfere with sales, and may result in damaged supplies or merchandise. Clearing customs tends to take longer for imports than exports across most regions, with the longest delays in Sub-Saharan Africa (figures 17l and 17m). Easing the flow of imports into a country helps local manufacturers and businesses obtain component parts of better quality or at lower cost. Enhancing customs capacity to clear exports and imports enables firms to benefit from a whole spectrum of productivity gains from trade.
In addition to burdensome customs clearance, obtaining necessary documents can be time-consuming and costly for some exports. Within agriculture, cereal exports are subject to more documentation requirements and longer phytosanitary certification than are other product categories, taking on average five days to be processed, compared with just over two days for vegetables. Additionally, the documents necessary to export cash crops tend to be costly (figure 17n).
Traders spend less time on customs clearance in countries with fully operational electronic systems that allow customs declarations to be submitted and processed online. Around 70 percent of countries have fully or partially implemented electronic data interchange systems (figure 17o).
Building statistical capacity
Timely, relevant, reliable, and high-quality data are fundamental to countries setting their own agendas and to monitoring progress toward national and global development goals. Goal 17 calls on countries to strengthen their statistical capacity by 2020 (target 17.18).
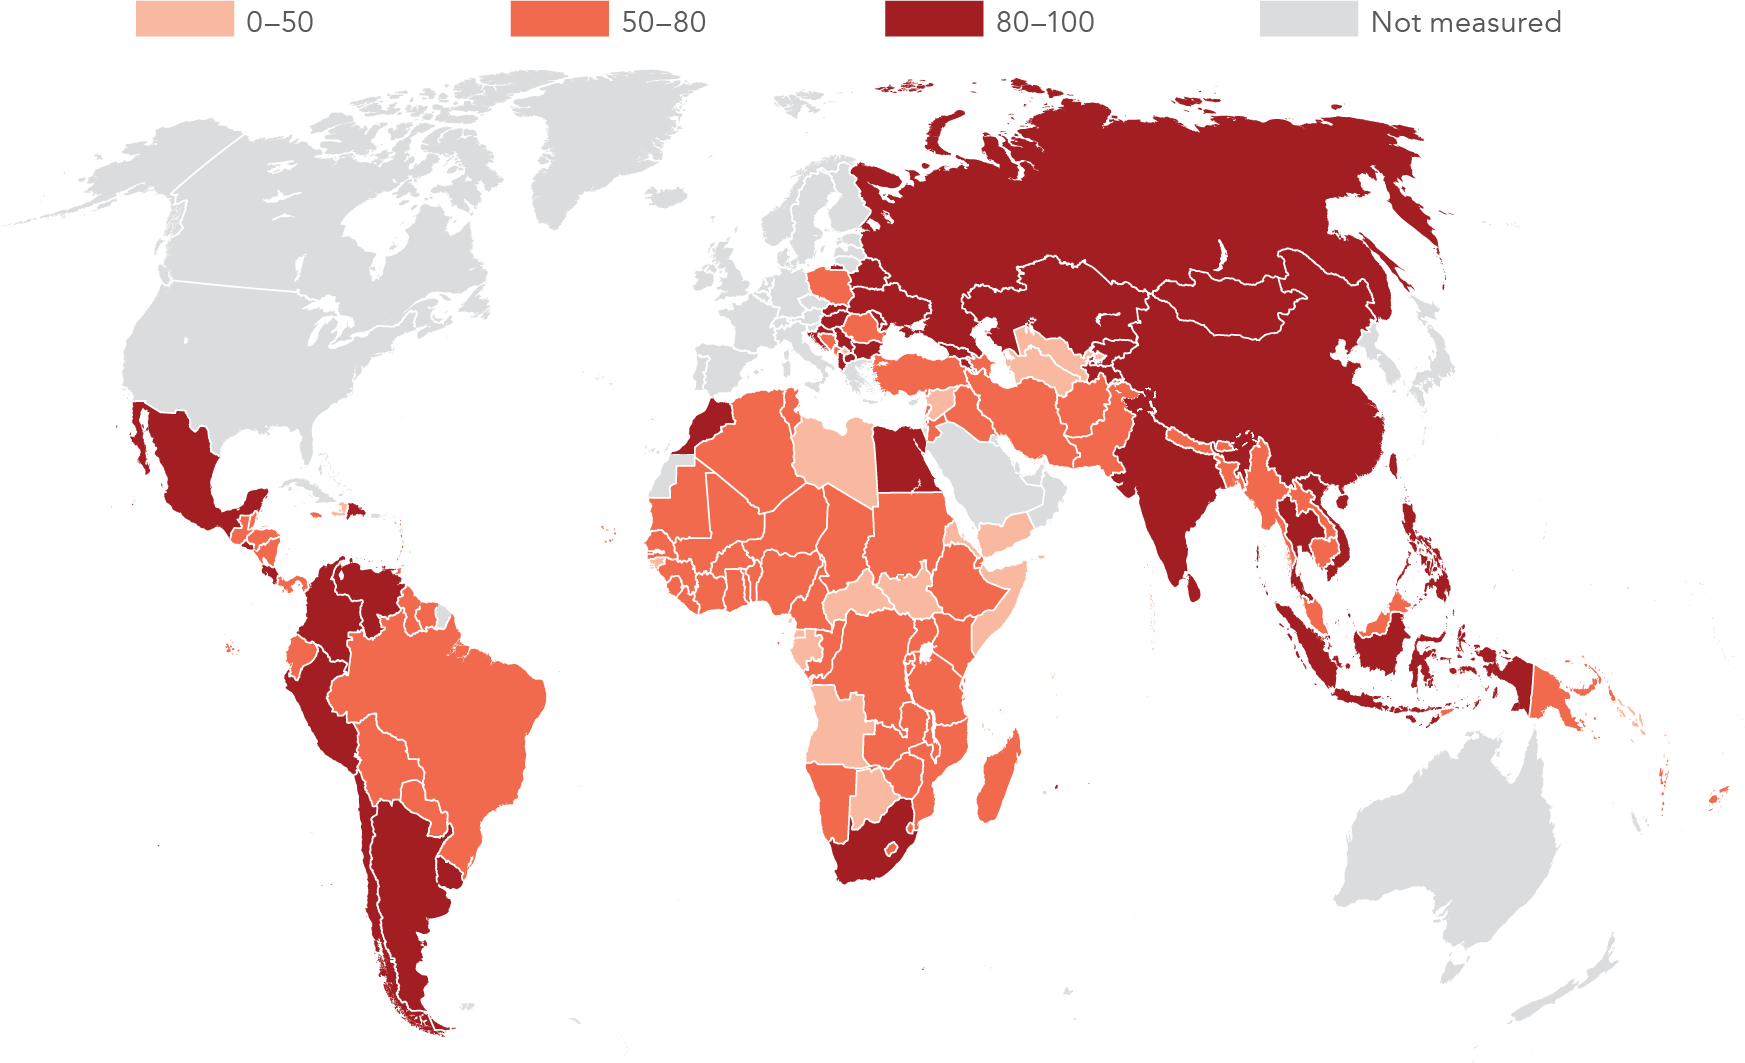
The World Bank's Statistical Capacity Indicator assesses a country's statistical system against numerous criteria on methodology, data sources, and periodicity and timeliness using publicly available information and country inputs. The overall statistical capacity score is then calculated as an average on a scale of 0 to 100.
Since 2004, around two-thirds of countries assessed have improved their scores, indicating a stronger ability to follow internationally recommended statistical methodologies and to collect and disseminate core socioeconomic statistics. But the scores for a third of countries fell between 2004 and 2016. Overall, 26 percent of all countries assessed in 2016 scored over 80, while 16 percent scored less than 50 (figure 17p).
A country's score may improve due to a range of factors. For the Dominican Republic more reliable national immunization estimation and a timely agricultural census contributed to an increase in its score from 71 in 2004 to 83 in 2016. For Serbia quality education statistics reported to the United Nations Educational, Scientific and Cultural Organization, use of the Balance of Payments Manual in data compilation, and an agricultural census all helped boost its score from 53 to 90. And for Tanzania improved periodicity of data on child malnutrition and maternal health helped boost its score from 68 to 73.
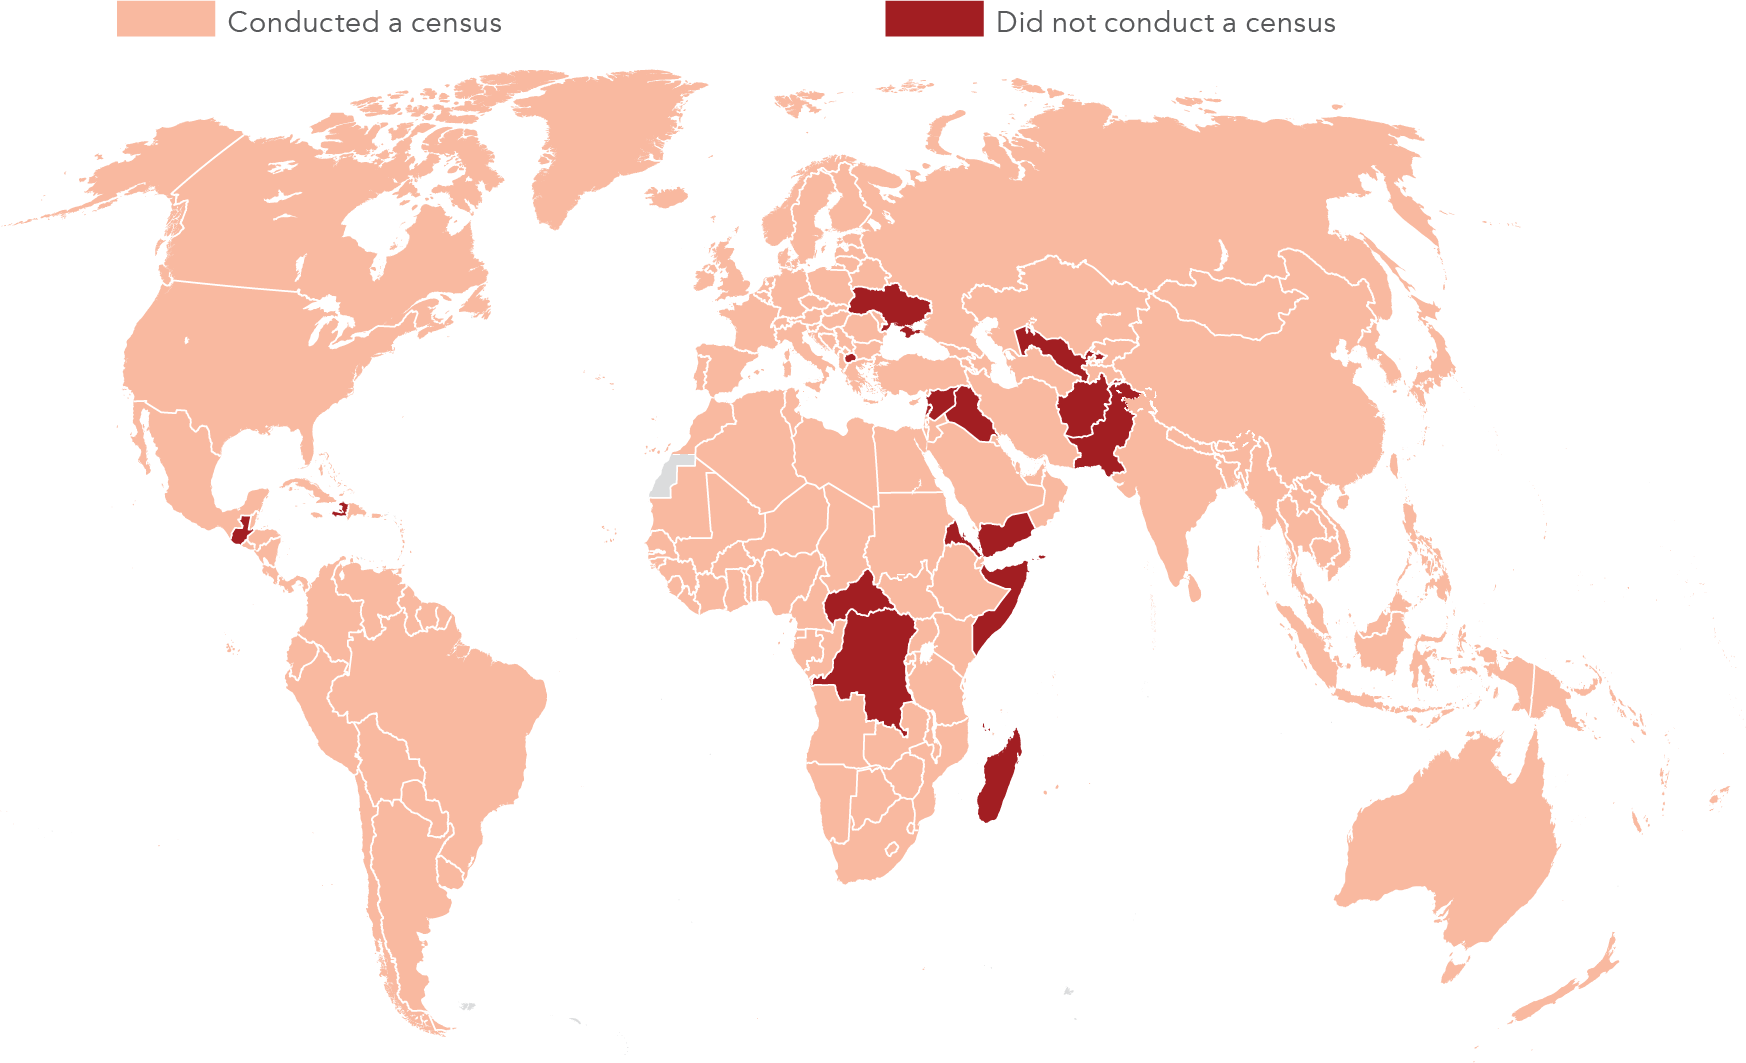
A population census aims to record the socioeconomic characteristics of the members of each household in a country. Comprehensive surveys are typically carried out every 10 years, but some countries, such as Australia, Canada, Ireland, Japan, and New Zealand, conduct them every five years. Timely censuses, as well as inclusive vital registration systems, are characteristics of a country with high statistical capacity (target 17.19). Only 17 countries worldwide did not conduct a census between 2005 and 2015 (figure 17q).
Notes
- This figure excludes ICT sector investments because methodological changes for this sector in 2015 render earlier years incomparable.