Promoting industry
Goal 9 promotes inclusive and sustainable industrialization (target 9.2). Manufacturing value added (MVA) is an indicator for assessing a country's industrialization, and MVA's share in gross domestic product (GDP) measures the role of manufacturing in the economy.
Worldwide, MVA as a share of GDP has been declining for more than two decades, from 21 percent in 1995 to 15 percent in 2014, in contrast to the rise in the share of services. It was lowest in Sub-Saharan Africa (11 percent) of regions with data available for 2015. By comparison, it was 16 percent in Europe and Central Asia, 16 percent in South Asia, and 14 percent in Latin America and the Caribbean. MVA per capita shows a similar pattern. It was $3,114 per person in Europe and Central Asia in 2015, $1,123 in Latin America and the Caribbean, and just $144 per person in Sub-Saharan Africa.
Sub-Saharan Africa also had considerable variation among countries (figure 9a). Equatorial Guinea, Mauritius, and Swaziland had the highest MVA per capita at $2,124, $1,209, and $1,188 in 2015, while most countries in the region recorded less than $200.1
Supporting rural markets and services
Investment in reliable, sustainable, and resilient infrastructure can provide remote populations with access to services (target 9.1). With better roads, farmers can bring produce to markets more efficiently, and families can more easily get to schools, hospitals, and other facilities. Enhancing rural road connectivity also helps in the long term by elevating agricultural productivity, business profitability, and employment.
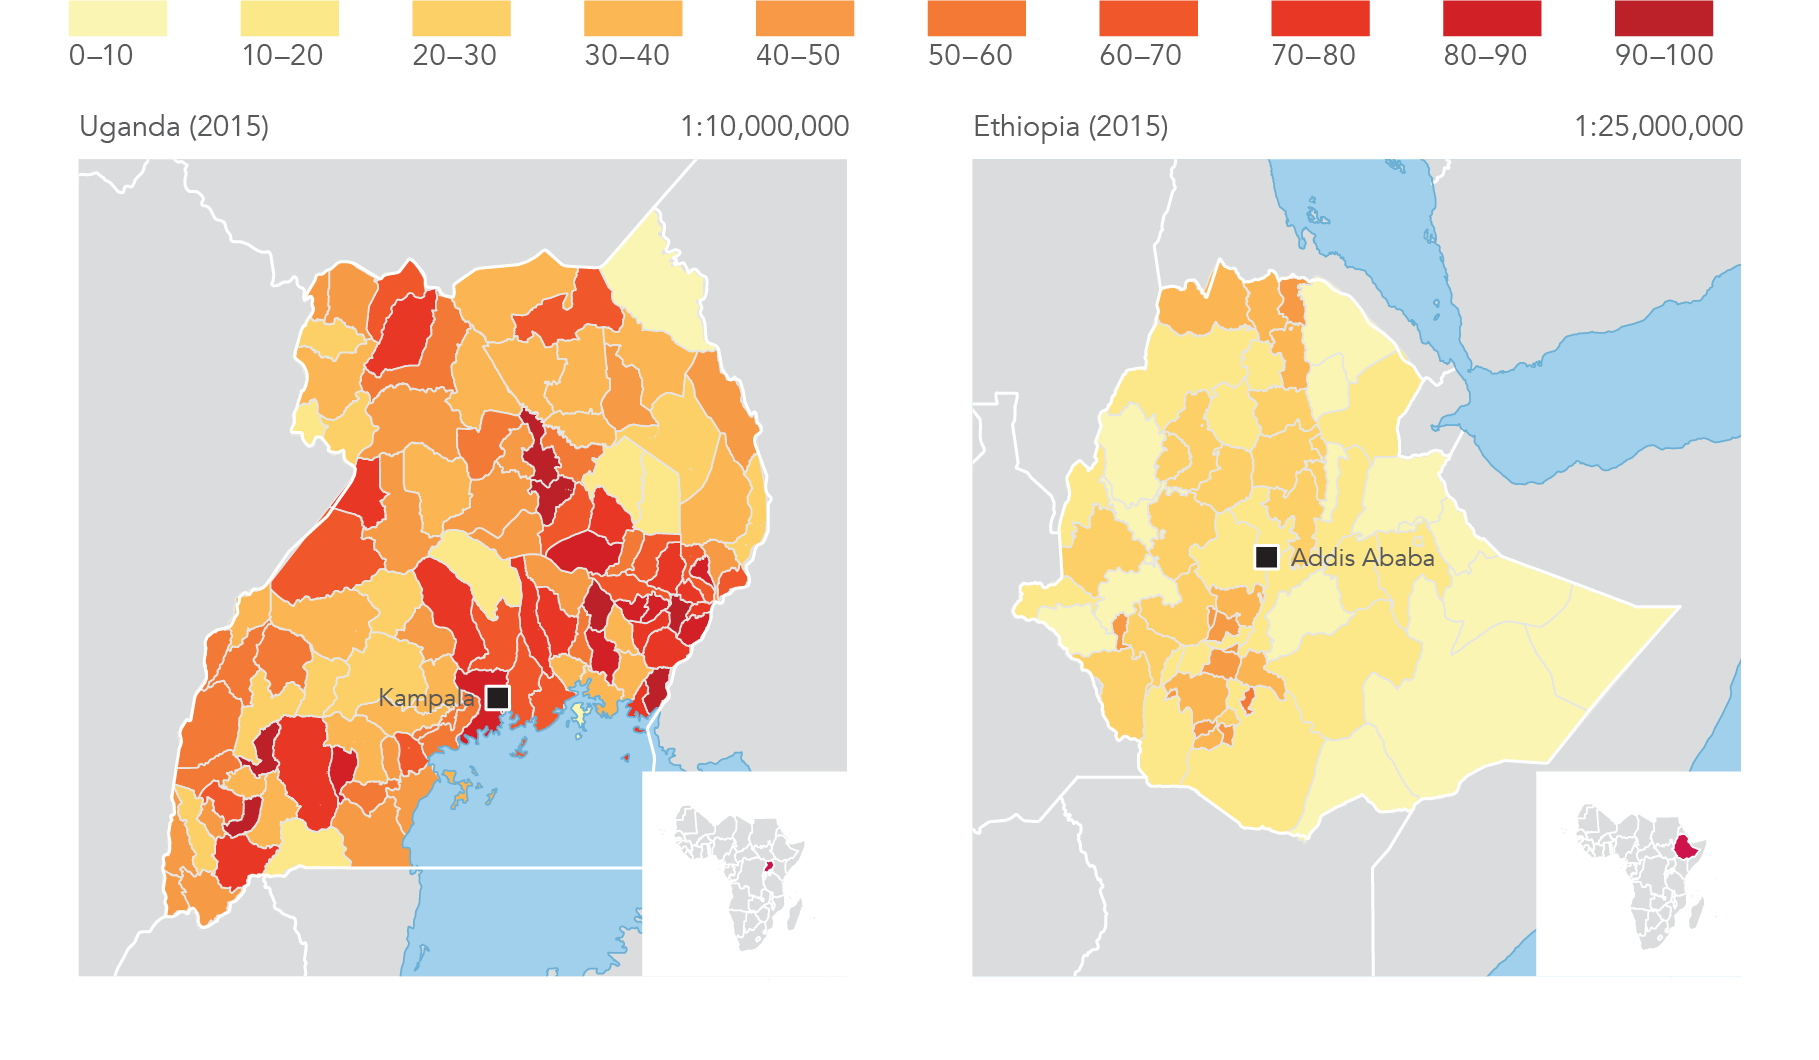
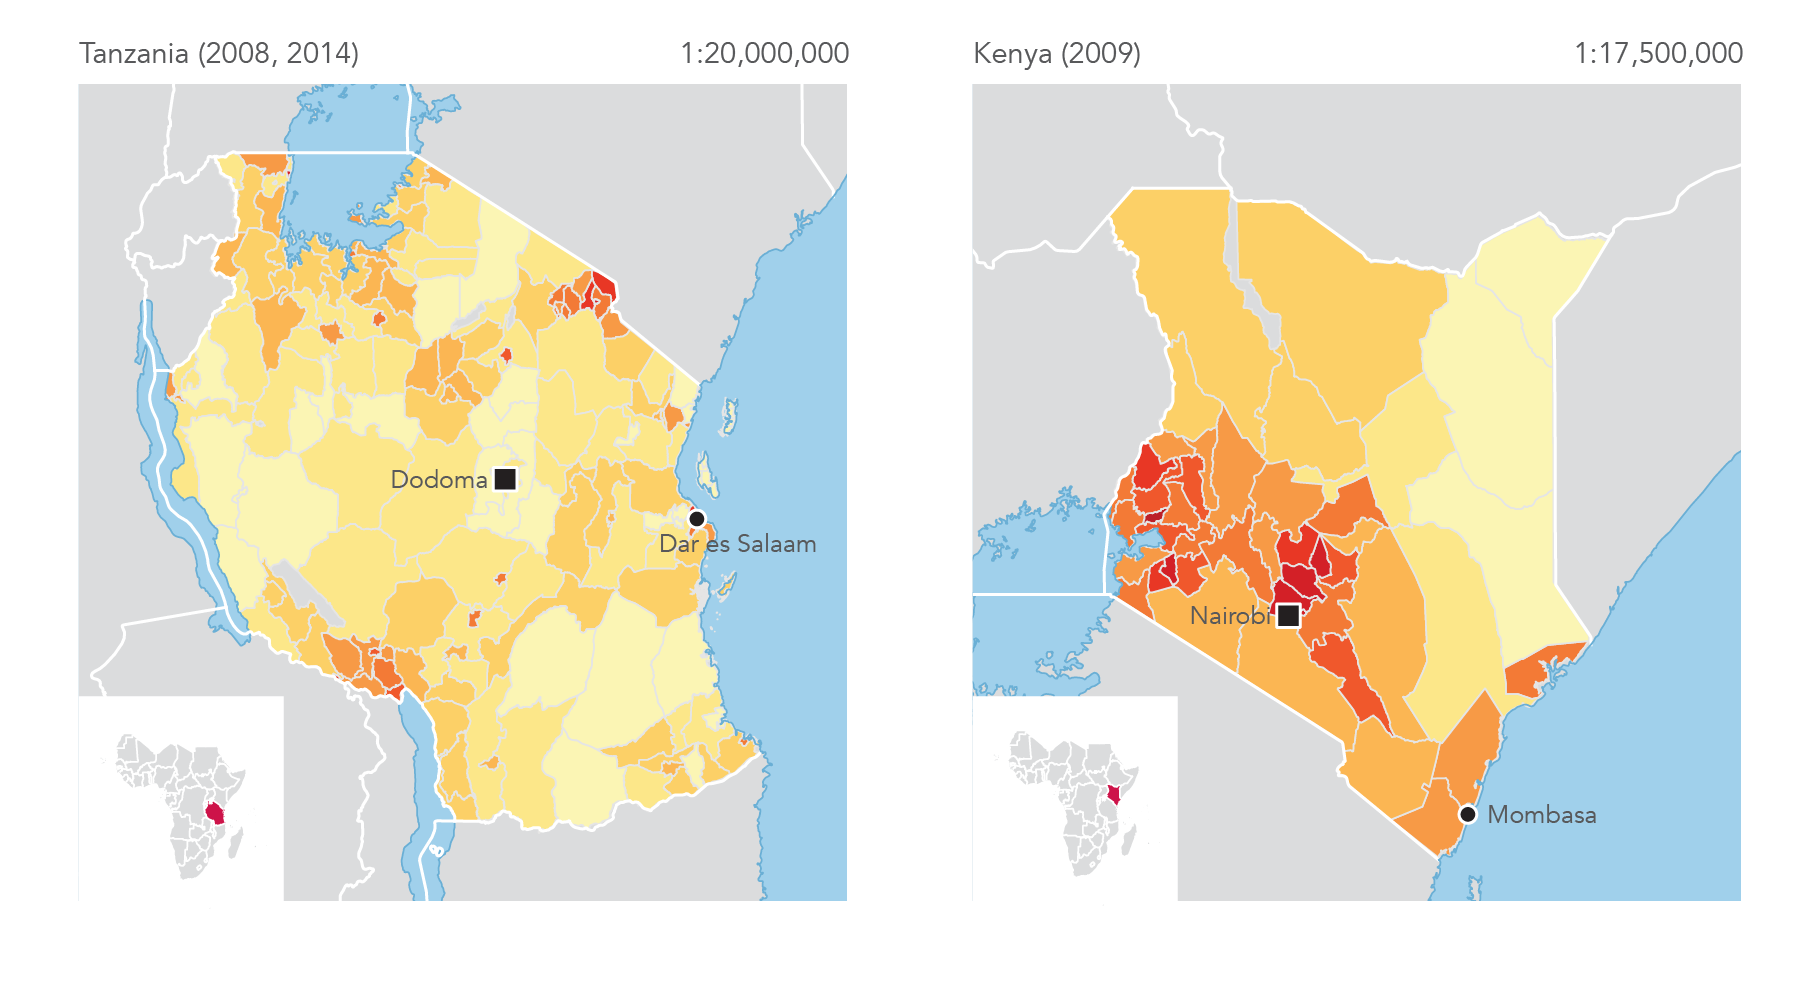
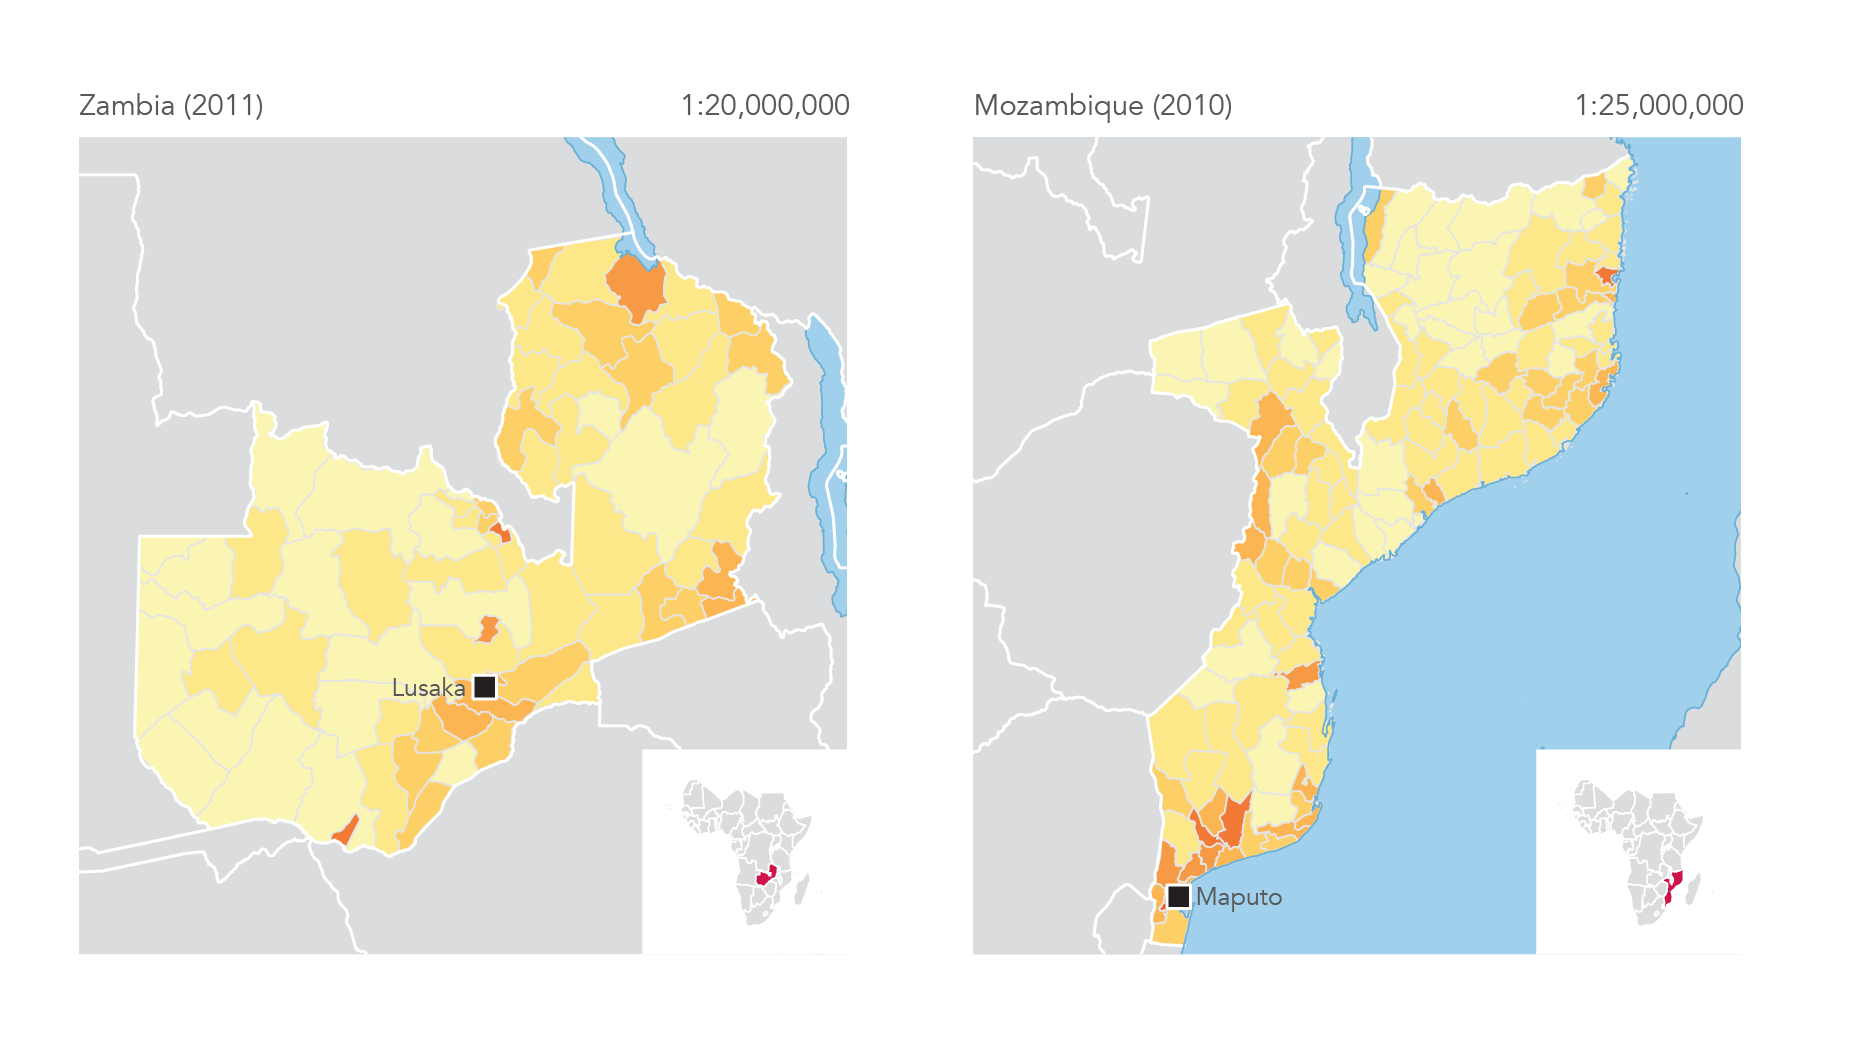
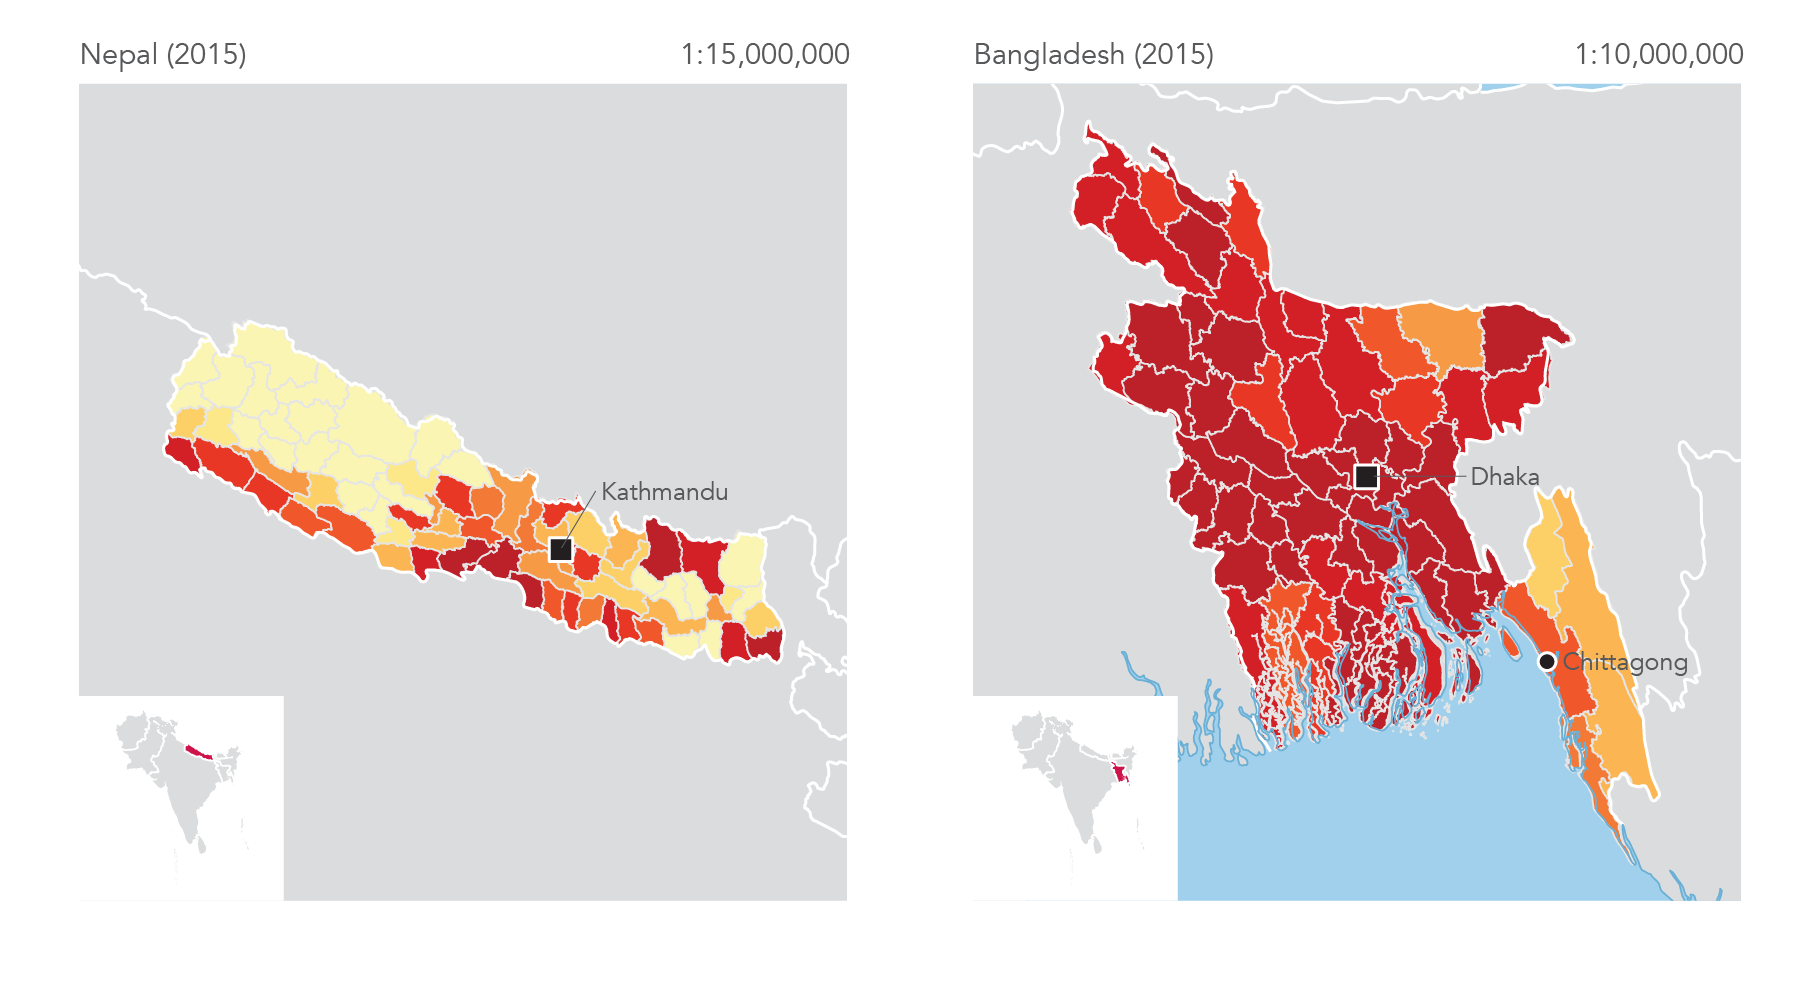
The rural access index (RAI) measures the proportion of people within two kilometers of an all-season road—a reasonable walking distance for people's normal economic and social purposes. RAIs are currently available for eight countries in Africa and Asia (figure 9d), integrating population data from censuses, surveys, social media, and administrative systems with satellite and other spatial datasets to produce high-resolution population distribution data. In addition to traditional road assessment surveys, road quality or "road roughness" data are captured through smartphone apps while driving matched with high-resolution satellite imagery.
Around 174 million rural dwellers in the eight countries lack good access to roads, of a total population of more than 461.7 million. Access varies according to population density, degree of urbanization, and level of economic development, and the rural access index ranges from 87 percent in Bangladesh to 17 percent in Zambia (figures 9b and 9c). But due to a much larger population, the number of people without access in Bangladesh (16 million) is more than twice that in Zambia (7 million). Of the eight countries, Ethiopia has the most people without access to an all-season road—almost 64 million.
Developing regional and transborder infrastructure
Reliable and frequent air transport is vital to efficient regional and transborder infrastructure (target 9.1). Between 2000 and 2015 global air passenger transport doubled, to reach 3.4 billion passengers, of which 1 billion were in carriers registered in East Asia and Pacific. The region tripled its passenger numbers between 2000 and 2015, a trend which has been driven primarily by China. Carriers registered in North America and in Europe and Central Asia accounted for 26 percent each of the global total.
Air freight rose by almost 60 percent between 2000 and 2015, to reach 188 billion ton-km globally (figure 9e). The share of global freight transported by carriers registered in the Middle East and North Africa increased rapidly from 4 percent in 2000 to 15 percent in 2015. The trend has been primarily driven by the United Arab Emirates and Qatar.
Improving resource-use efficiency
Goal 9 seeks to improve resource-use efficiency and promote greater adoption of clean and environmentally sound technologies and industrial processes (target 9.4). Carbon dioxide (CO2) emissions per unit of GDP captures efficiency in both energy production and consumption, along with use of fuels and clean technologies.
Global CO2 emissions per unit of GDP declined by about one quarter during the last two decades. Only the Middle East and North Africa showed a slight increase during this period. East Asia and Pacific has the highest carbon intensity of GDP, despite a 13 percent decline between 1990 and 2013 The carbon intensity of GDP fell by 38 percent in North America and by 42 percent in Europe and Central Asia over the same period.2
Encouraging innovation
Investing in research and development (R&D) across sectors and facilitating innovation in science and technology are two ways that Goal 9 hopes to raise the competitiveness of developing countries (target 9.5). R&D expenditure as a share of GDP and the proportion of people working in R&D tend to be highest in high-income economies. Japan invested nearly 4 percent of GDP in R&D in 2014, higher than the shares invested in recent years by Singapore, the United States, and other upper-middle-income economies including China, Russia, and Malaysia (figure 9f). Japan recorded nearly 2,600 patent applications per million people in 2014, the highest of any country, indicative of its supportive environment for innovation.
Financing small and medium-size enterprises
Access to financial services enables firms to smooth cash flows, accumulate assets, make productive investments, and promote better use of resources (target 9.3). Yet many small enterprises around the world, formal or informal, lack the financing they need. Enterprise surveys3 in East Asia and Pacific during 2015 and 2016 showed that, in the 10 economies surveyed, small and medium-size enterprises are credit-constrained (figure 9g). In Thailand only one in ten SMEs has a loan or line of credit, and in Vietnam fewer than one in four SMEs.
Notes
- Data for Swaziland are for 2014.
-
Data for Europe and Central Asia cover the period 1992–2013.
-
World Bank Enterprise Surveys have been collecting firm-level data (representative of an economy's private sector) in more than 130 economies around the world for over 10 years. Surveys are implemented every year in around 20 countries.