Ensuring access to safe and adequate housing
Achieving Goal 11 requires providing access for all to basic services and to adequate, safe, and affordable housing (target 11.1). For many cities this means improving and upgrading slum areas, where many of the poor live. According to the United Nations Human Settlements Programme (UN-HABITAT), slums are areas where households lack durable housing, sufficient living space, secure tenure, or easy access to safe water or adequate sanitation facilities.
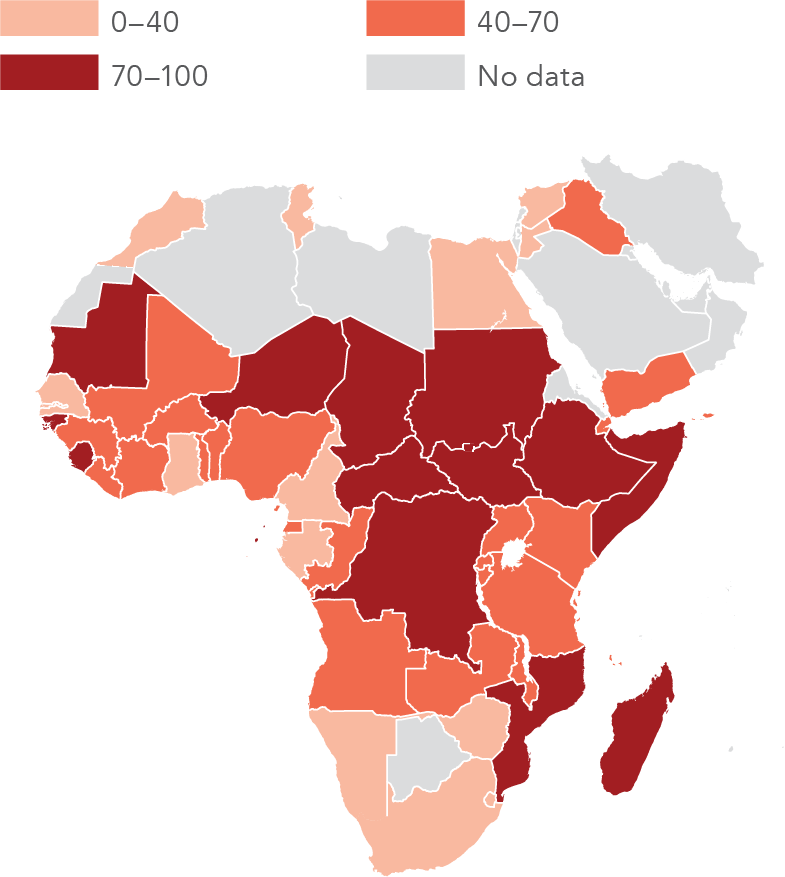
Countries have made considerable progress in recent years, but the percentage of urban populations living in slums1 remains very high. In Sub-Saharan Africa an average of 67 percent of the urban population was living in slum conditions in 1990; by 2014 this had fallen to 55 percent (figure 11a). But the last decade saw rises in several countries. Between 2005 and 2014, slum populations in Burkina Faso rose by 6 percentage points, in Lesotho by nearly 16 percentage points, and in Zimbabwe by 7 percentage points.
Improving air quality in cities
As rural residents move to cities in search of better livelihoods, reducing the adverse impact on the environment is crucial to building safer and more sustainable cities (target 11.6). Air quality and waste management are two areas of environmental impact needing urgent attention.
Air quality is commonly measured by levels of PM2.5: particulate matter less than or equal to 2.5 microns in diameter. The World Health Organization recommends that PM2.5 levels not exceed 10 micrograms per cubic meter as a guideline for average annual PM2.5. Long-term exposure to pollution above this level has been shown to increase the risk of fatal illness. It is estimated that nearly 92 percent of the world's people live in places where this safe level is exceeded.2 In three regions levels of mean annual exposure have worsened since 1990, and the global level increased from 39.6 micrograms per cubic meter in 1990 to 44 in 2015. Of the 194 countries with data in 2015, only 26 reported safe levels of PM2.5, and in 145 countries more than 99 percent of the population was exposed to unsafe levels. In Egypt, Qatar, and Saudi Arabia, the PM2.5 levels are 10 times the recommended level—more than 100 micrograms per cubic meter (figure 11b).
Defining "urban"
The terms "urban" and "rural" are often used to understand how environments and the lives of those within them differ around the world. But there is no consistent international definition of "urban." Instead, each country has its own classifications to identify its urban population, and these vary widely across countries. Criteria include combinations of population size, population density, type of economic activity, physical characteristics, and level of infrastructure.
About 100 countries use some form of minimum population threshold to define a settlement as "urban." These thresholds range from as few as 200 people to as many as 50,000. The average minimum population threshold is just under 5,000 inhabitants (figure 11c).
This inconsistency is like comparing apples and oranges, where a city of 1,000 is urban in one country, while a city of 10,000 is rural in another. These conflicting definitions make it difficult to make meaningful cross-country comparisons, let alone establish consistent estimates of urbanization worldwide.
The European Commission (EC) has developed an approach to standardize the definition of urban areas by using population distribution grids consisting of one square kilometer cells. "High density" clusters of grid cells are those with 1,500 inhabitants per square kilometers and a minimum combined population of 50,000. "Urban" clusters have 300 inhabitants per square kilometers and a minimum combined population of 5,000, while "rural" clusters make up all remaining grid cells.
Gridded population distribution data are available from WorldPop3 and Global Human Settlements Population Layer (GHS Pop).4 Analyzing these datasets using the EC clustering approach results in higher estimates of urban population (64 percent on average) for the 80 countries in the analysis, relative to estimates from the United Nations World Urbanization Prospects,5 which relies on national definitions of urbanization (57 percent on average).
The distribution of urban populations across regions varies dramatically depending on the approach. Using the EC clustering approach, countries in Asia and Africa appear to be more urbanized than their national definitions of "urban" would suggest, whereas the opposite is true for countries in Latin America (figure 11e).
As satellite data continue to become available at higher frequencies and resolutions, we draw closer to standardizing the way urbanization is defined and measured globally. The German space agency DLR recently released a global map of built-up areas derived from radar data (Global Urban Footprint),6 and the European Space Agency's Urban Thematic Exploitation Program7 allows nontechnical users to customize results through supercomputing power and tools. These advances herald a new frontier in understanding urbanization worldwide.
Notes
- The proportion of people living in slums is measured by a proxy, represented by the urban population living in households with at least one of four characteristics: lack of access to an improved water supply; lack of access to improved sanitation facilities; overcrowding (three or more persons per room); and dwellings made of nondurable material.
-
See WDI indicator PM2.5 air pollution, population exposed to levels exceeding WHO guideline value (% of total) (EN.ATM.PM25.MC.ZS). Data are as of February 1, 2017.
- http://www.worldpop.org.uk/.
- http://ghsl.jrc.ec.europa.eu/.
- https://esa.un.org/unpd/wup/.
- http://www.dlr.de/.
- https://urban-tep.eo.esa.int.