Doing more with less
Goal 12 aims at "doing more and better with less," increasing net welfare gains from economic activities by reducing resource use, degradation, and pollution. It involves different stakeholders across the full production cycle, including business, consumers, policymakers, media, and communities. It addresses aspects ranging from resource and chemical use to food loss, solid waste, recycling, consumer behavior, subsidies, technology, tourism, and government procurement.
Balancing the use of natural resources to foster growth
Goal 12 encourages the efficient use and sustainable management of natural resources (target 12.2). The difference between national production and consumption—the policy-induced change in a country's wealth—is measured by adjusted net savings. This takes into account investment in human capital, depreciation of fixed capital, depletion of natural resources, and pollution damage. Consistently negative saving rates indicate diminishing wealth and unsustainable development. Positive savings form the basis for future growth.
Resource-rich countries that depend heavily on extractive industries ideally balance the depletion of their natural resources by investing in other forms of capital, such as building human capital through education. A comparison of average saving rates to the average share of natural resource rents in national income over 1990 to 2014 reveals that many low-income countries are undercutting the productive base of their economies over the longer term (see figure 12c on page 70). Adjusted net savings in low-income countries averaged -0.4 percent of gross national income (GNI), meaning their national savings and investment in human capital are less than their capital depletion. In contrast, it averaged +13.7 percent of GNI in the lower-middle-income countries, +15.6 percent in upper-middle-income countries, and +8.6 percent in high-income countries.
Forgoing some consumption by increasing savings and reinvestment of resource rents is a tough proposition in poorer countries, where living standards are already low. But improving the sustainable and efficient management of resources in these countries will be critical for long-term growth and development.
Minimizing food loss and waste
Food loss can occur at any stage of the food supply chain, and refers to decreases in both food quantity and food quality. Goal 12 seeks to minimize waste throughout the chain (target 12.3). Food loss estimates are based on FAO food balance sheets that do not, however, include post-consumer food waste. Per capita food losses have risen in most regions since 1995 and are now highest in Latin American and the Caribbean, where they averaged 521 kilocalories per capita a day in 2011, up from 329 in 1995 (figure 12a). North America dropped considerably from 190 kilocalories per capita a day in 1995 to the lowest of all regions (71 kilocalories per capita per day) in 2011. Food waste by consumers may account for 28 percent of total food loss in the high-income countries and 7 percent in low- and middle-income countries.1
Since 1995 food loss has risen in nearly all categories of food. Fruits and vegetables, and dairy and eggs were lost in 2011 at a rate nearly 50 percent higher than 16 years previously. Only meat, offal, and animals fats fell, with losses in 2011 amounting to around half that lost before reaching consumers in 1995 (figure 12b).
To provide a more complete and accurate picture of global food loss, the Food Loss and Waste Accounting and Reporting Standard was announced at the Global Green Growth Forum in Copenhagen in June 2016.2 It provides a flexible measurement tool to allow governments, institutions, and agricultural producers and companies to consistently and credibly measure, report on, and manage food loss and waste. Users can identify both food types and inedible parts, and the end destination of those parts—such as food consumed, animal feed, composting, landfill, refuse, or sewer. A suite of quantification methods under the standard gives users a range of technologies and resources to assess food loss on a
comparable basis.
Recycling and reusing waste
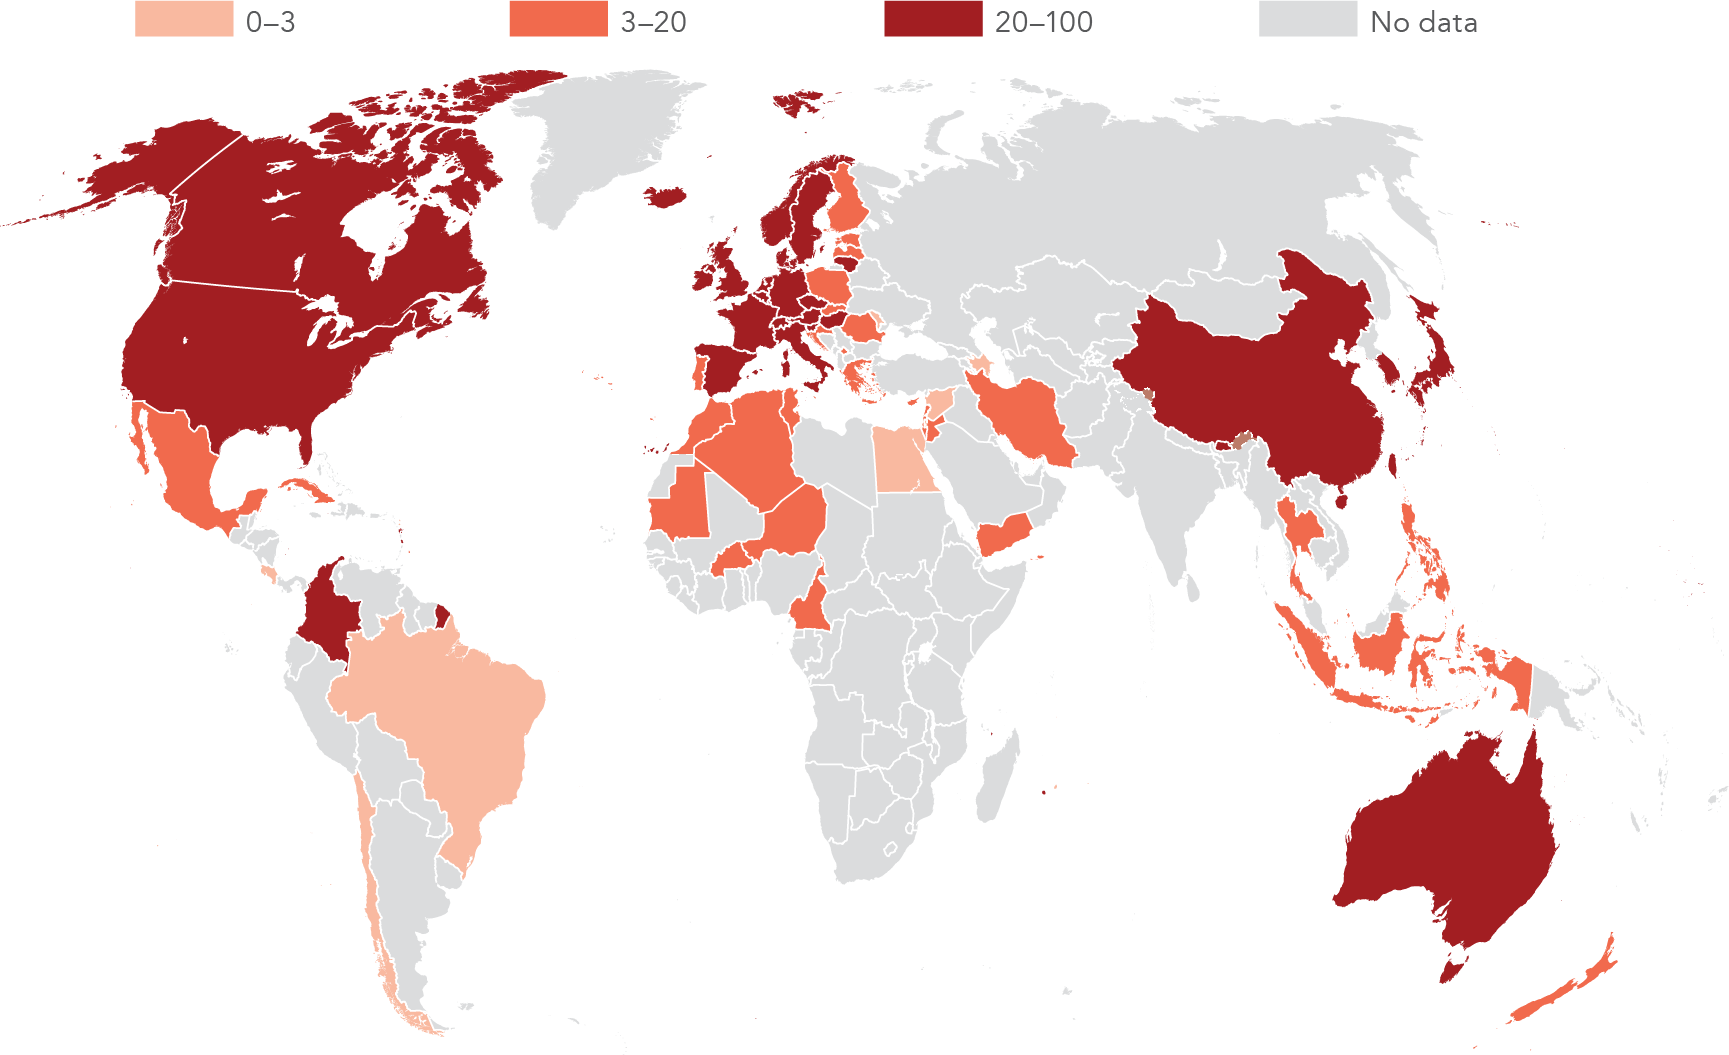
Goal 12 calls on nations to substantially reduce waste through prevention, reduction, recycling, and reuse (target 12.5). Many high-income countries recycle at least a fifth of their municipal solid waste, which is most commonly recorded at the point of final disposal, for example, by weighing trash trucks when they arrive at landfill sites (figure 12d). In low- and middle-income countries, most recycling is through the informal sector and through waste picking, so accurate data are hard to collect, and the contribution of this sector to waste reuse may be underestimated. The International Labour Organization (ILO) estimates that as many as 15 to 20 million people in these countries earn their living from informal recycling activities.3 And it is estimated that informal waste pickers in India collect and recycle about 60 percent of the 5.6 million tons of plastic waste that the country generates each year.4
Adopting sustainable practices
Reporting on sustainability measures has emerged as common practice among many of the world's largest companies. Goal 12 encourages such reporting and the integration of good sustainable processes in all industries and sectors (target 12.6). More than 80 percent of the S&P 500 companies reported on sustainability in 2015, up from just 20 percent in 2011 (figure 12e).5 Globally, about 73 percent of the largest 100 companies in 45 countries surveyed by KPMG (4,500 companies) report information on corporate responsibility. Three-quarters of these companies reference established guidelines for sustainability reporting by the Global Reporting Initiative, but fewer than half have their corporate responsibility information independently verified and assured by a third party.6 The growth in sustainability reporting by industry leaders reflects a growing demand by investors and governments for greater disclosure. In 2016 governments in more than 50 countries had regulations, guidance, standards, or other policies to encourage or require sustainability reporting by companies and other organizations.7
Notes
- B. Lipinski, C. Hanson, J. Lomax, L. Kitinoja, R. Waite, and T. Searchinger. 2013. "Reducing Food Loss and Waste." Working Paper, World Resources Institute, Washington, DC.
- World Resources Institute. 2016. Food Loss and Waste Accounting and Reporting Standard. Washington, DC. http://www.wri.org/sites/default/files/FLW_Standard_Exec_Summary_final_2016.pdf.
-
Cited in P. Bhada-Tata and D. Hoornweg. 2015. "Solid Waste and Climate Change." In State of the World: Can a City Be Sustainable?, edited by L. Mastny, p. 249. Washington, DC: Island Press.
- S. Singh. 2013. "India Reports Plastic Waste and Recycling Statistics." Plastics News, May 1. http://www.plasticsnews.com/article/20130501/NEWS/130509998/india-reports-plastic-waste-and-recycling-statistics.
- Governance & Accountability Institute. 2016. "Flash Report: Eighty One Percent (81%) of the S&P 500 Index Companies Published Corporate Sustainability Reports in 2015." http://www.ga-institute.com/nc/issue-master-system/news-details/article/flash-report-eighty-one-percent-81-of-the-sp-500-index-companies-published-corporate-sustainabi.html.
- KPMG. 2015. Currents of Change: The KPMG Survey of Corporate Responsibility Reporting 2015. Amsterdam: KPMG. http://www.kpmg.com/crreporting.
- KPMG, Global Reporting Initiative, United Nations Environment Programme, and University of Stellenbosch Business School Centre for Corporate Governance in Africa. 2016. Carrots & Sticks: Global Trends in Sustainability Reporting Regulation and Policy. Amsterdam: KPMG. http://www.sseinitiative.org/wp-content
/uploads/2016/05/Carrots-Sticks-2016.pdf.