Expanding access to drinking water and sanitation
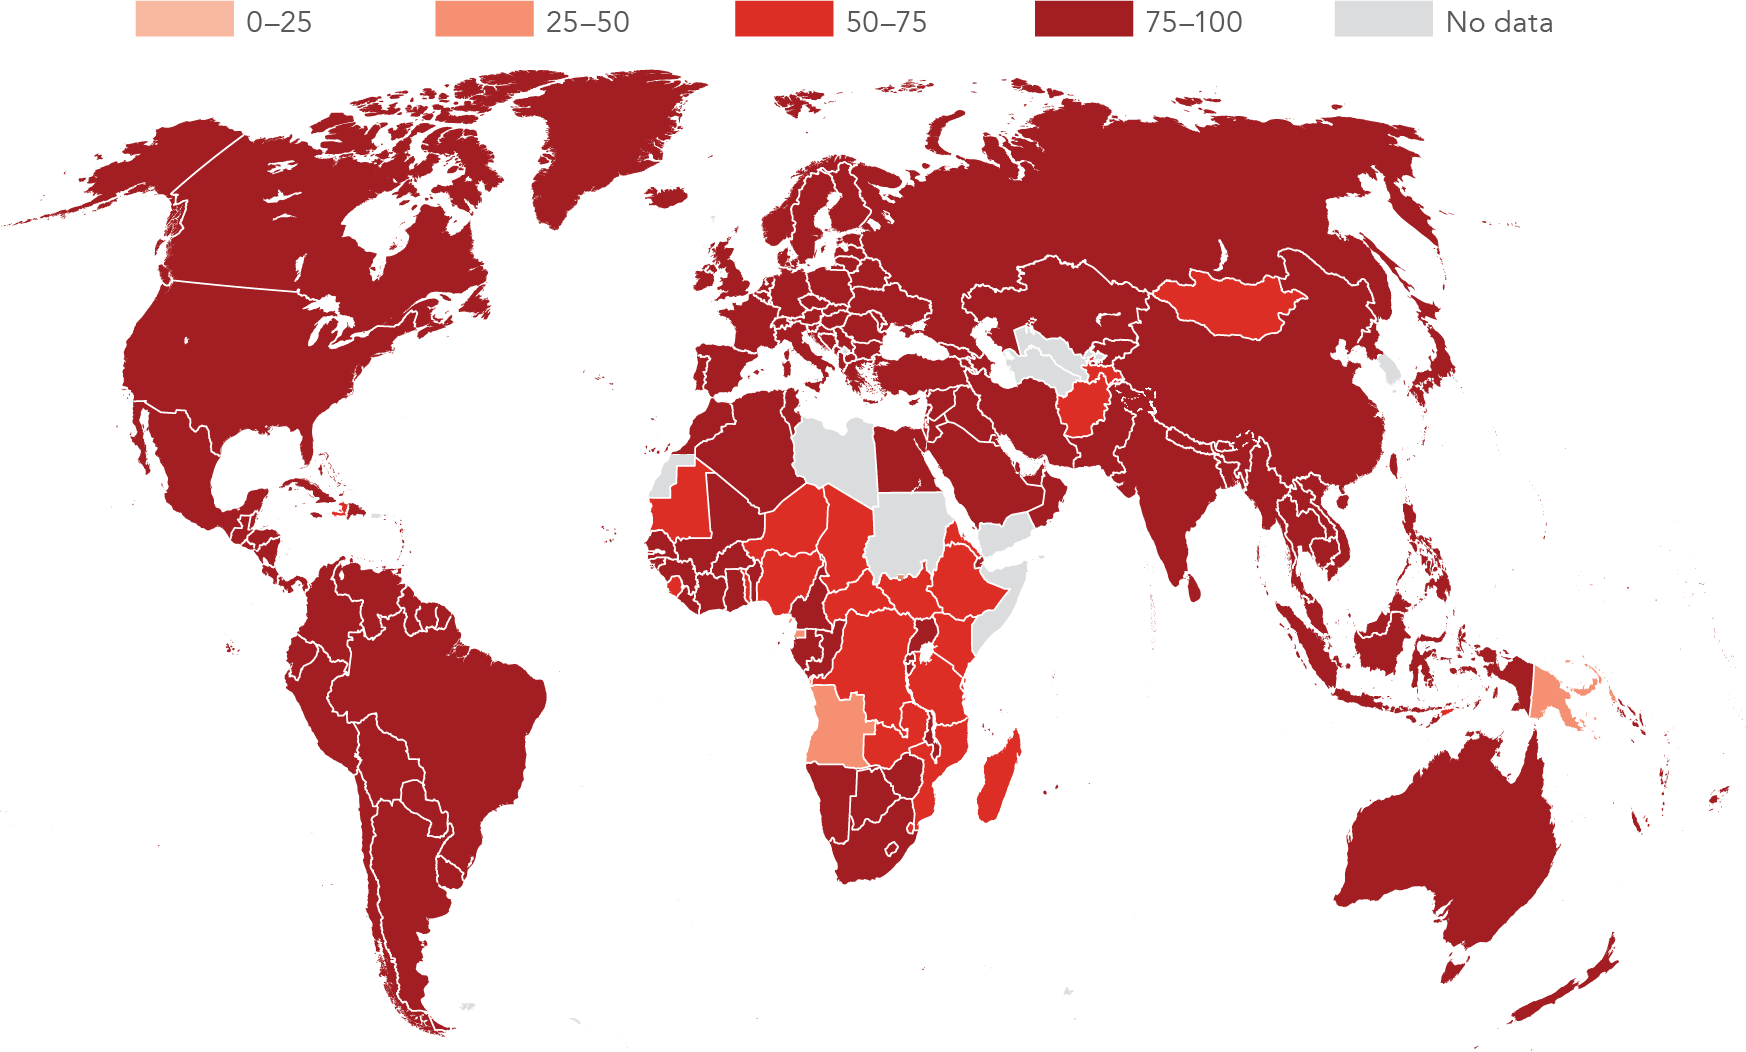
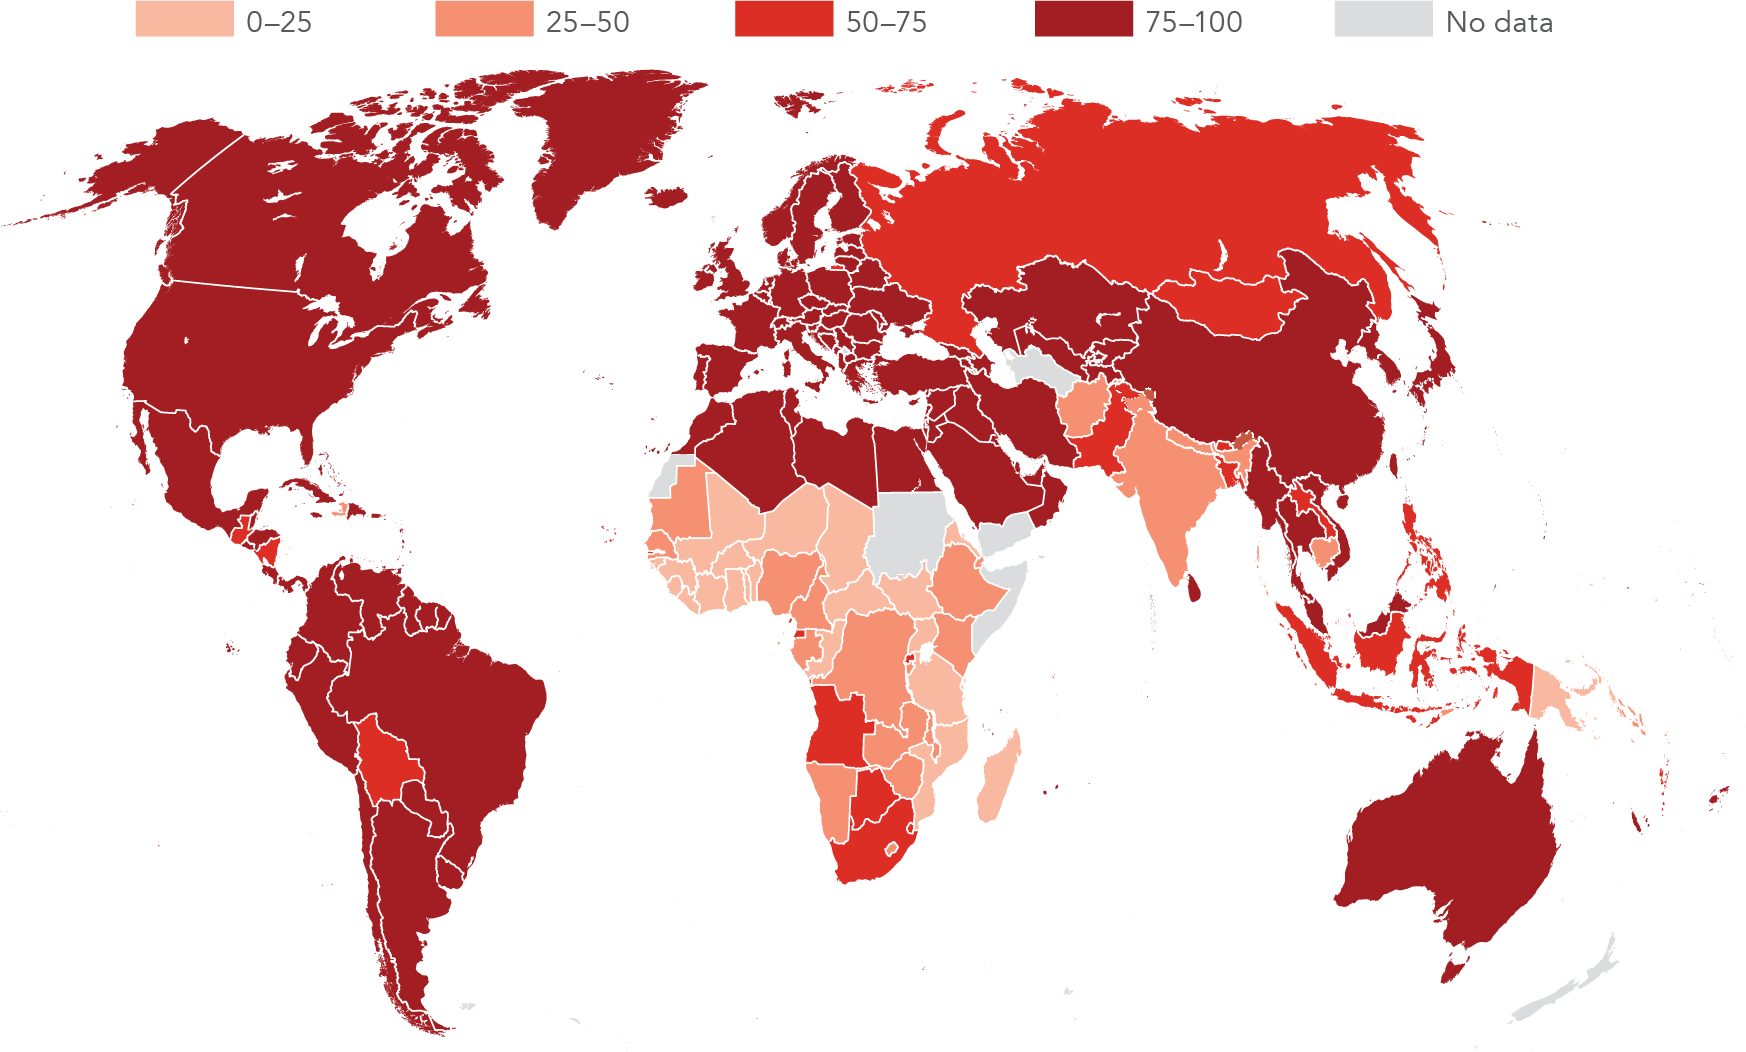
Until recently countries reported their populations' access to water and sanitation by distinguishing between "improved" and "unimproved" coverage. In 2015, 663 million people were drinking from unimproved sources such as unprotected dug wells, and 2.4 billion lacked improved sanitation facilities. The bulk of those without were in Sub-Saharan Africa and South Asia (see figures 6d and 6e on page 34), where rural dwellers, especially the poorest, lagged behind others in access to both water and sanitation (figures 6a, 6b, 6f and 6g).
Measuring access more comprehensively
Goal 6 commits to universal access to water, sanitation, and hygiene under a new, broader, and more refined monitoring framework (targets 6.1 and 6.2). The unimproved–improved distinction is replaced by "safely managed" services. For water, this requires that the household's drinking water source is on premises, available when needed, and free of fecal and locally relevant chemical contaminants. For sanitation, emphasis is on the links in the sanitation chain from initial defecation through waste management (including containment, disposal, and transport of human excreta), and on the availability of an appropriate handwashing facility. Monitoring these components and inequalities will help assess progress toward the longer term aim of universal access.
Household surveys will increasingly measure these new components, but at present, data are limited. Available data show how the refined methodology can affect measures of access. For example, in Niger 66 percent of the population has access to an improved source of water, but new data show that only 10 percent have access on premises (figure 6c). Those without on-premise access must plan ahead to collect water, an exercise that can take up to 30 minutes (the threshold for "basic water"—another measure sometimes used) or even longer (improved, but not basic).
Even if data are not yet available on all aspects of safely managed water, there generally is information on improved water on premises, and access to safely managed water can be no higher than that. On average across six countries, 60 percent of urban dwellers and 75 percent of rural dwellers previously classified as having access would now be considered to be without access. When other new requirements of access are considered, the shares are likely to fall further.1 These refined measures can help quantify major issues invisible in previous definitions.
Incorporating handwashing in the definition of sanitation access has a similar impact. A 54-country study found that the handwashing criterion was unmet for between 4 percent (Serbia, and Bosnia and Herzegovina) and 99 percent (Liberia and Ethiopia) of the population.2 In another study of 10 countries, access to cleansing materials—fundamental to women for menstrual hygiene management—was below 25 percent in more than half the countries.3 Such data4 can give new insights to sanitation challenges facing different populations and enable countries and the international community to refine and focus service provision.5
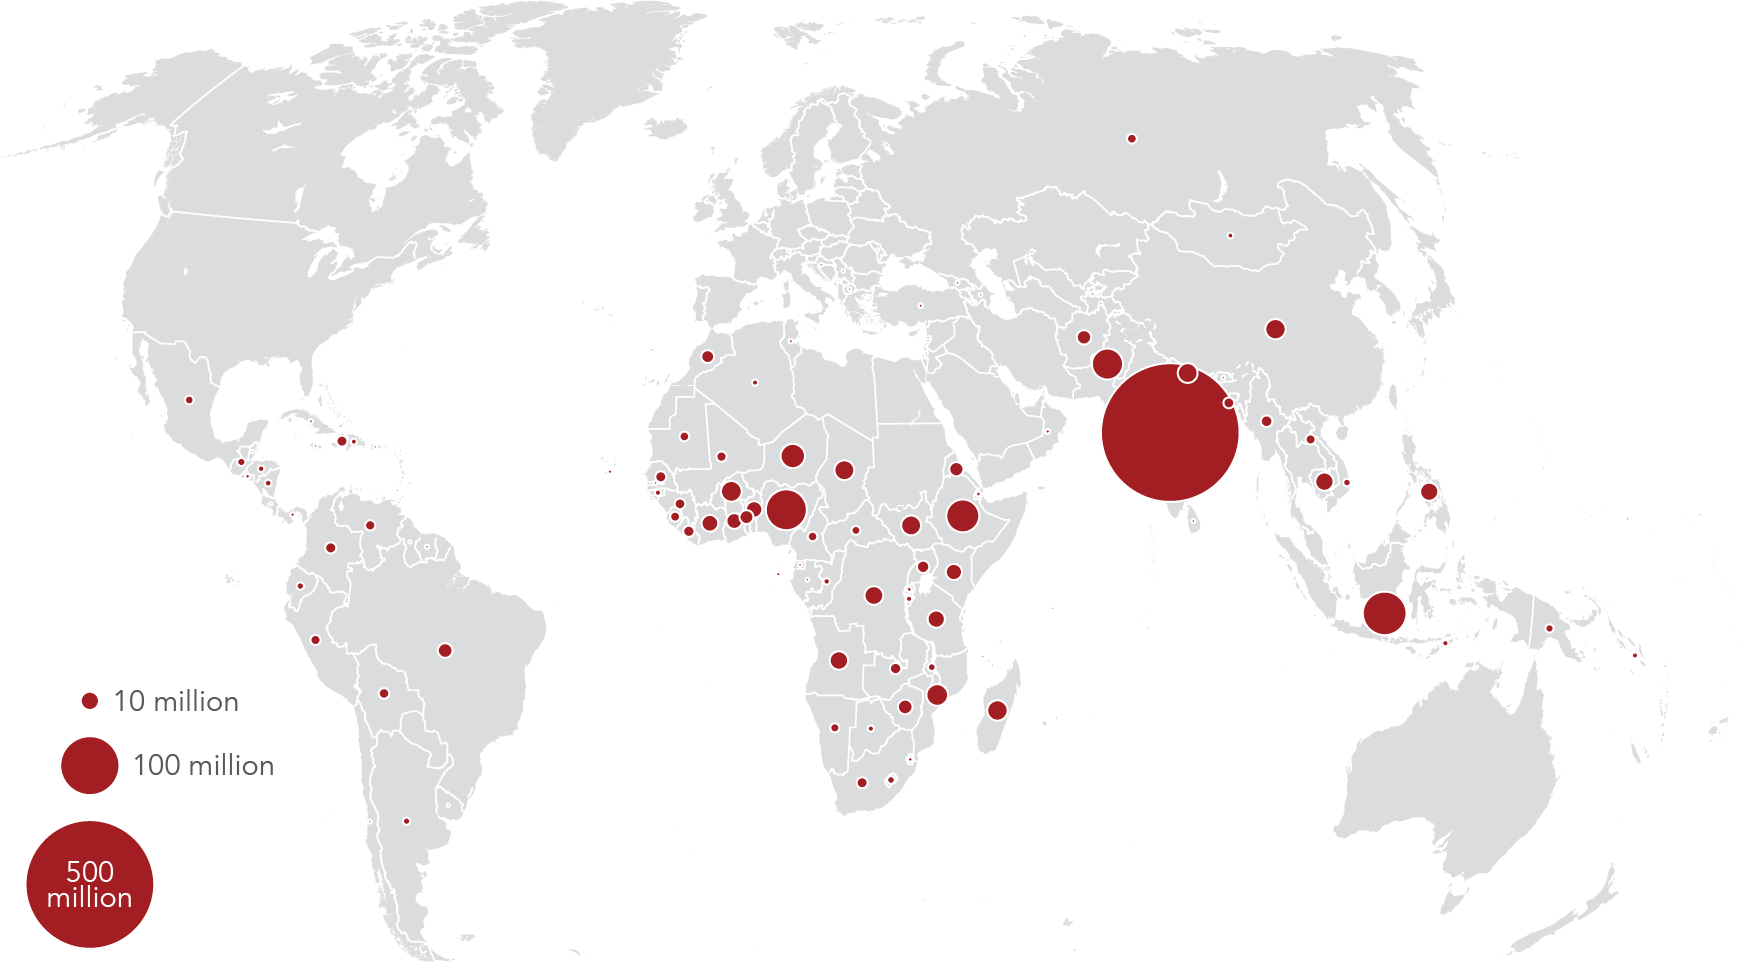
Ending open defecation
The elimination of open defecation is an urgent priority (target 6.2). In 2015, an estimated 946 million people defecated in the open—for example, outside in street gutters, behind bushes, or into open bodies of water (figure 6h). This contaminates drinking water sources and spreads deadly diseases such as cholera, diarrhea, and dysentery. Open defecation is particularly acute among the rural poor in South Asia and Sub-Saharan Africa.
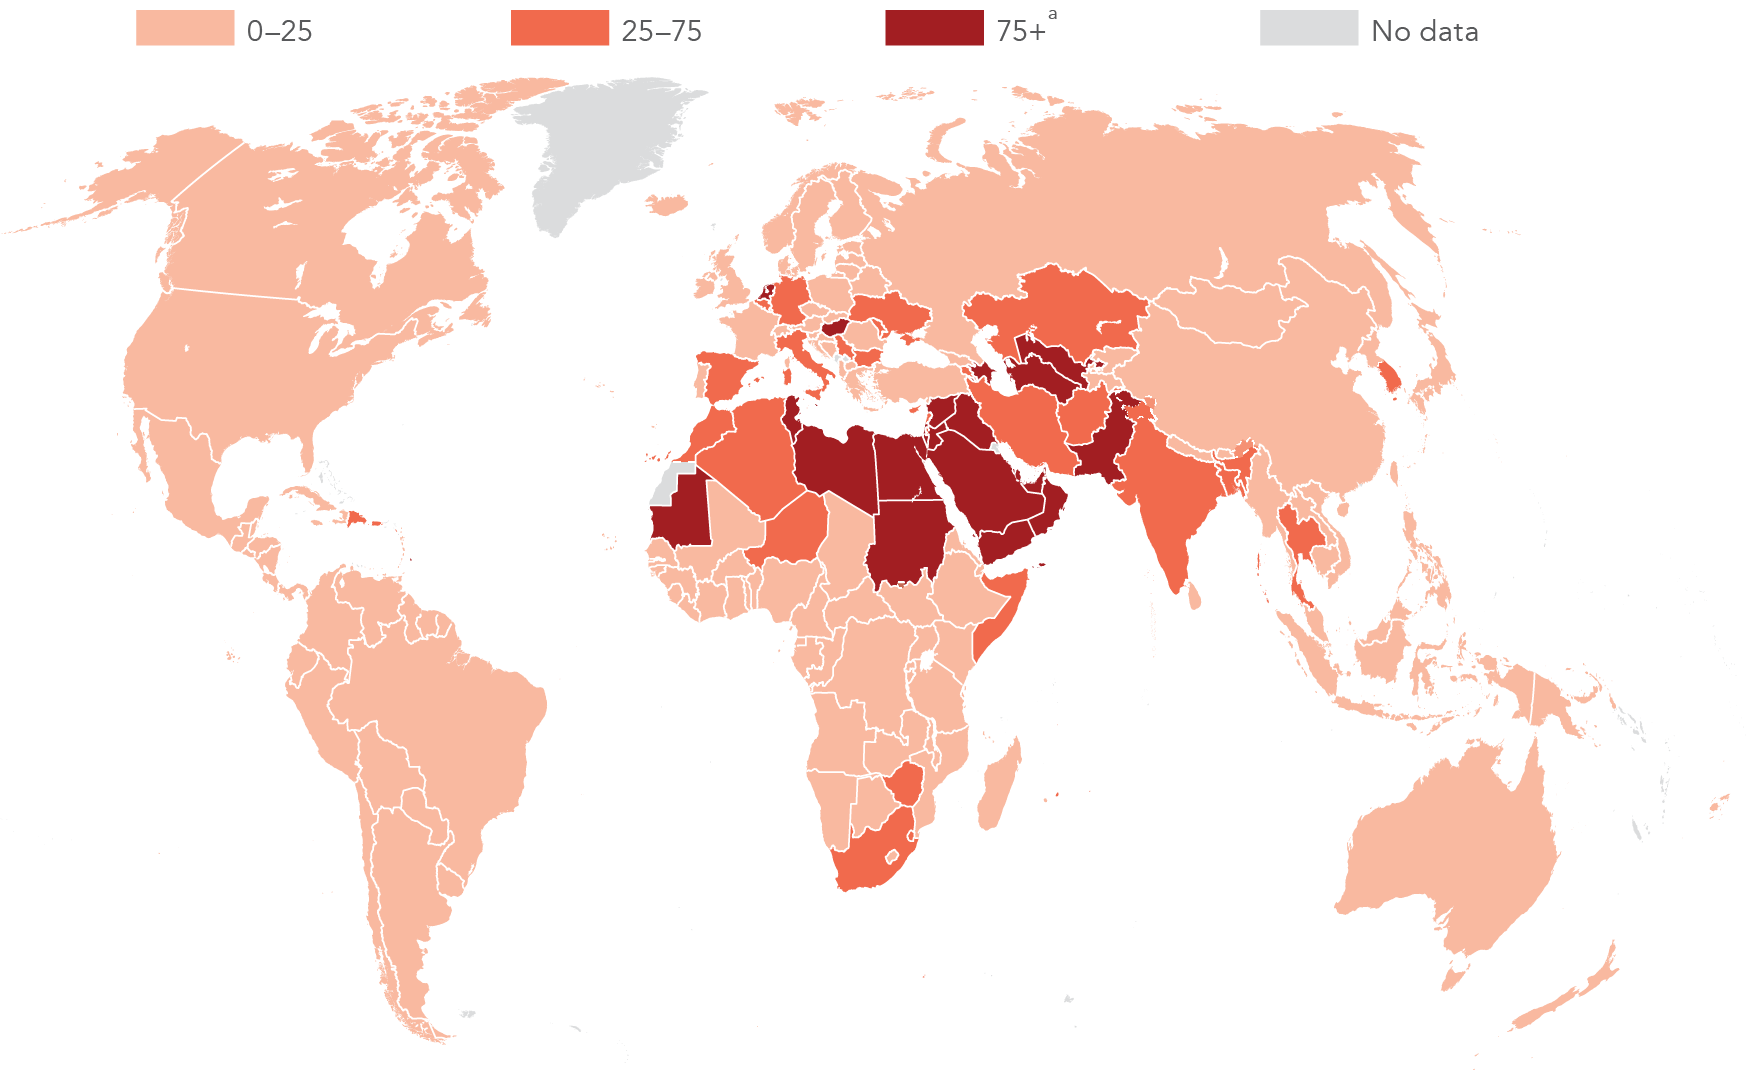
Addressing the entire water cycle
Goal 6 recognizes that sustainably managing water goes beyond simply providing a safe water supply and sanitation, as it addresses broader water cycle issues of water quality and wastewater (target 6.3); water use and scarcity (target 6.4); water resource management (target 6.5); and ecosystems (target 6.6). All these issues influence access, particularly for regions facing increasingly frequent extreme weather events due to climate change, urbanization pressures, and shifting pollution patterns.
Globally, water supplies per person halved over the past 50 years, and water shortages affect many countries (figure 6i). Ninety percent of water withdrawals in low-income countries went to agriculture in 2014, while industry had the highest share in high-income countries (44%).
Monitoring and managing water resources
Managing and assessing water resources rely on incorporating new data sources, such as satellite measures of aquifer levels. Increased analytical precision, integration of information and of national programs, and multinational cooperation are critical to improve monitoring and translate global ambitions into national action.
This will require increased participation by local communities and other stakeholders (acknowledged in target 6.b). Of 94 countries in a recent UN survey round, 83 percent reported having clearly defined procedures for stakeholder participation in water, sanitation, and hygiene planning, but fewer than half had even "moderate" implementation.6
Improved water management should be seen in context. Advances in equitable access to water and sanitation contribute to progress in health, nutrition, food security, gender equality, disaster resilience, environmental sustainability, and many other areas.7 For example, access to water, sanitation, and handwashing contributes to inclusive and effective school learning environments, promoting the goal of quality education for all.8
Notes
- The Water Supply, Sanitation, and Hygiene (WASH) Poverty Diagnostic has been working to examine the implications of adopting the new measurements of access.
-
WHO/UNICEF Joint Monitoring Programme (JMP) for Water Supply and Sanitation, 2015, Progress on Sanitation and Drinking Water—2015 Update and MDG Assessment.
-
Loughnan, L., Bain, R., Rop, R., Sommer, M., and Slaymaker, T. 2016. "What Can Existing Data on Water and Sanitation Tell Us About Menstrual Hygiene Management?" Waterlines 35(3).
-
The most comprehensive assessment of the baseline global situation under these new measurements will be released by the World Health Organization/United Nations Children's Fund Joint Monitoring Programme in 2017–18.
-
World Bank WASH Poverty Diagnostic 2016.
-
UN-Water. 2016. Integrated Monitoring Guide for SDG 6 Targets and Global Indicators. Geneva.
-
Integrated monitoring of water and sanitation related SDG targets – GEMI: http://www.unwater.org/gemi/.
- Indicators for target 4.a—see United Nations Economic and Social Council 2015 Report of the Inter-Agency and Expert Group on Sustainable Development Goal.